Decoding the Perkins V Blueprint for Career-Connected Education
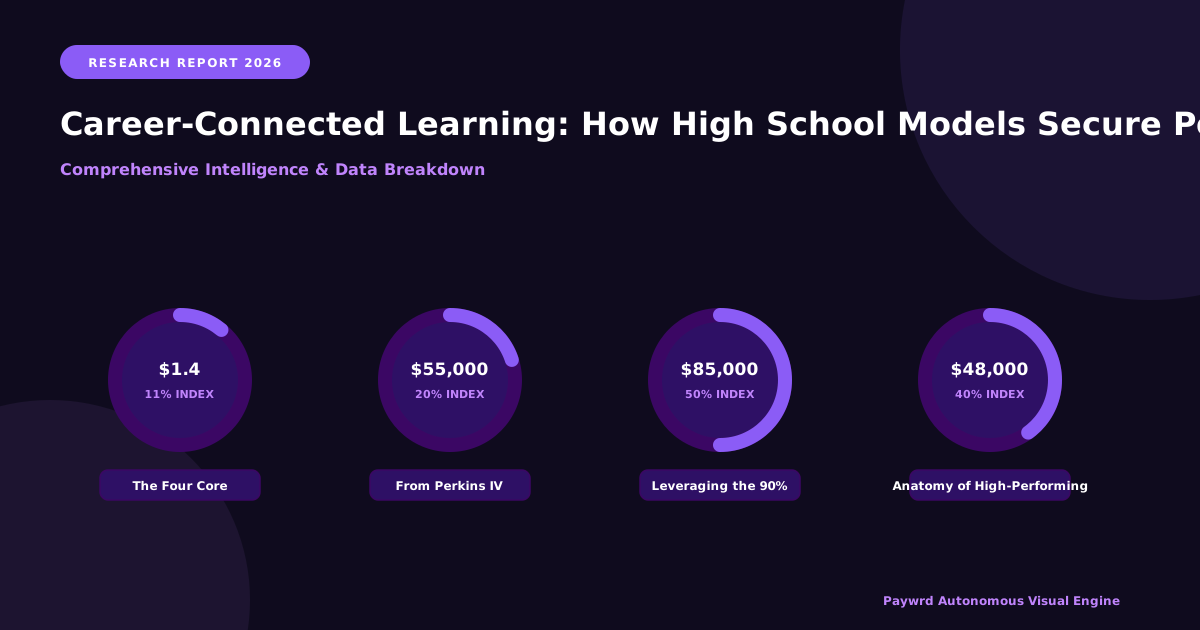
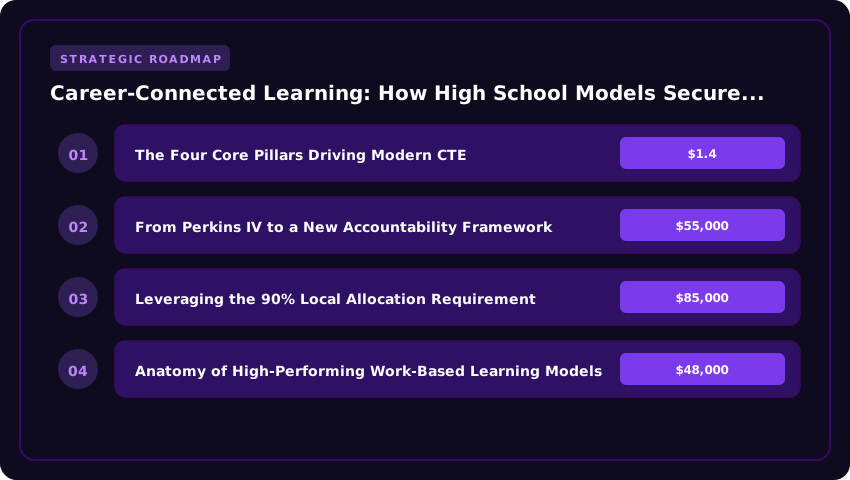
When the Strengthening Career and Technical Education for the 21st Century Act (Perkins V) passed in 2018, it fundamentally rewired how American high schools approach career readiness. Signed into law to replace the aging Perkins IV framework, this legislation governs roughly $1.4 billion in annual federal funding distributed through the U.S. Department of Education to state CTE directors, who then pass those dollars down to local eligible recipients. For career-connected learning programs aiming to build sustainable apprenticeship and work-based learning ecosystems, understanding this blueprint is the difference between securing a multi-year grant and watching a program deflate.
The Four Core Pillars Driving Modern CTE
Perkins V rests on four statutory pillars that dictate how every dollar must flow. First, size, scope, and quality requirements force local programs to expand beyond a single classroom into rigorous, industry-aligned career pathways. Second, the local needs assessment mandate requires school districts to consult directly with local employers, parents, and secondary partners before drafting a spending plan. Third, the comprehensive local needs assessment (CLNA) acts as a data-driven GPS, ensuring programs address skill gaps identified by regional labor market information. Finally, program of study alignment ensures students transition seamlessly from high school credentials into postsecondary training or registered apprenticeships.
From Perkins IV to a New Accountability Framework
Perkins IV operated under a compliance-driven model that often rewarded program enrollment rather than actual student success. The updated Perkins V accountability framework flips that script. Now, state agencies measure performance against core indicators including post-program placement, credential attainment, and non-traditional program participation. Schools that fail to meet state-negotiated performance levels risk losing their federal CTE dollars entirely. According to the latest data from the U.S. Department of Education, states must report these secondary core performance indicators annually, creating a transparent ranking system where high-performing districts gain flexibility and struggling programs face mandatory improvement plans.
Leveraging the 90% Local Allocation Requirement
Here is where the funding architecture becomes critical for local program directors. Federal law mandates that states distribute at least 90% of remaining Perkins funds to local eligible recipients based on population and poverty factors. The remaining 10% covers state administration and leadership. For district administrators, this means CTE funding flows almost entirely to the local level, provided programs can demonstrate alignment with the CLNA. Schools looking to maximize this allotment should prioritize work-based learning expenditures, such as industry-recognized credentialing, dual enrollment partnerships with regional community colleges, and paid internship coordination, all of which meet the legislation’s emphasis on employer engagement.
- Federal Floor: Perkins V allocates roughly $1.4 billion annually nationwide through formula grants to states.
- Local Pass-Through: A mandatory 90% of state reserves must reach local CTE programs after administrative costs.
- Accountability Shift: Funding follows performance against measurable career outcomes rather than mere enrollment figures.
- Industry Voice: Local employers must formally participate in the CLNA process to unlock full funding eligibility.
Anatomy of High-Performing Work-Based Learning Models
Walk through any top-tier career-connected program in the United States, and you will notice the same pattern. The most successful high schools do not treat work-based learning as a one-off internship sprinkled onto a senior schedule. Instead, they engineer deliberate, multi-year architectures where classroom theory, employer mentorship, and credentialing line up like precision gears. Perkins V rewards exactly this kind of intentional design, because federal dollars under the Strengthening Career and Technical Education for the 21st Century Act follow programs that can prove students are mastering skills that employers actually need.
Industry-Aligned Apprenticeship Pipelines for High School Credit
The first structural pillar separating elite programs from average ones is a registered apprenticeship pipeline that travels backward from the employer. Schools partner with regional industry leaders, often through their local Workforce Development Board, to map which occupations are paying $55,000 to $85,000 within five years of graduation. Once those targets are locked in, the high school reverse-engineers its course sequence. A junior studying mechatronics, for instance, might split the day between advanced manufacturing coursework and 12 hours per week of paid lab time at a partner fabrication shop. Those hours convert into transcripted math, science, and elective credit. By senior year, the student exits with a USDOL-registered apprenticeship credential, often 2,000+ hours of On-the-Job Learning (OJL), and a standing job offer that frequently pulls a starting salary between $48,000 and $62,000, depending on the Bureau of Labor Statistics (BLS) regional data.
Simulated Workplace Environments vs. Authentic Employer Immersion
The second major structural decision is whether to build a lab or book a flight. Many Tier-1 campuses run hybrid models. A healthcare academy might simulate a fully stocked patient room inside the school building for skills practice, then rotate students into a partnering hospital every other week for authentic clinical immersion. Programs that lean too heavily on simulation risk failing the Perkins V accountability lens, because the act explicitly pushes for “meaningful work-based learning experiences” with real employers. Districts that allocate their Perkins funds toward transportation, liability insurance, and coordinator stipends for these immersions consistently post higher concentrator placement rates and stronger nontraditional completion metrics.
Dual Enrollment Structures Producing Stackable Industry Certifications
The third pillar is dual enrollment, but not the kind that simply transfers a generic English composition credit. High-performing schools bundle dual credit with stackable, industry-recognized certifications. A construction pathway student might leave high school holding OSHA 30, NCCER Core, and an associate degree concentration in Construction Management, all before turning 19. These micro-credentials compound. Each one adds roughly $3,000 to $7,000 in annual earning power according to recent BLS wage differentials. Perkins V funds the articulation agreements, the credentialing exam fees, and the embedded college instructors who teach the dual-credit courses inside the high school building, which dramatically lowers the cost barrier for families navigating FAFSA eligibility and postsecondary planning.
- Pipeline first, curriculum second. Map the high-wage occupation, then design the course sequence backward.
- Hybrid immersion wins. Combine simulated practice with weekly authentic employer sites to satisfy federal accountability.
- Stack credentials aggressively. Pair dual enrollment with OSHA, NCCER, CompTIA, or similar certifications to accelerate wage growth.
Unlocking Non-Federal Funding Streams to Stretch Your Perkins V Budget
Relying solely on the Strengthening Career and Technical Education for the 21st Century Act (Perkins V) base allocation can leave even the most innovative Career and Technical Education (CTE) programs running on fumes. Federal formula dollars rarely cover the true cost of modern equipment, industry certifications, or paid work-based learning experiences. Smart CTE directors know the real resilience strategy lives in diversified revenue, blending federal allocations with state, regional, and private capital to build a budget that actually matches the cost of preparing students for high-wage careers.
State-Level Workforce Development Board Grants and RFP Cycles
Every state operates a Workforce Development Board (WDB) under the Workforce Innovation and Opportunity Act (WIOA) umbrella, and these boards control discretionary funds that local education agencies often overlook. State WDBs regularly release Requests for Proposals (RFPs) targeting high-demand sectors like advanced manufacturing, healthcare, information technology, and clean energy. Tracking the state’s procurement portal and subscribing to the WDB mailing list gives CTE directors a competitive edge. Grant awards typically range from $50,000 for targeted equipment purchases to $500,000 for multi-school consortium models. The application sweet spot is a narrative that explicitly aligns with the state’s WIOA Unified Plan and names local employer partners willing to co-invest.
Workforce Innovation and Opportunity Act (WIOA) Partnership Opportunities
WIOA Title I youth funding flows directly to American Job Centers and local workforce boards, creating a powerful partnership lane for high schools serving students aged 14 to 24. Co-enrolling CTE participants as WIOA youth allows schools to access Individual Training Account dollars for industry-recognized credentials, supportive services like transportation and childcare, and paid work experiences that federal Perkins dollars cannot fund. The U.S. Department of Labor reports average youth participant costs around $3,500 annually, meaning a partnership serving just 25 students injects nearly $90,000 of additional capacity into a CTE program. Memoranda of Understanding (MOUs) with local Workforce Development Boards formalize referral pipelines and shared case management.
Private Sector Co-Investment from Regional Employer Consortiums
Employer consortiums represent the fastest-growing funding stream for career-connected learning because regional industries have a direct financial stake in the talent pipeline. Healthcare systems, manufacturers, and tech employers routinely contribute equipment donations, instructor stipends, apprenticeship sponsorship, and facility upgrades in exchange for first-in-line access to job-ready graduates. A regional manufacturer consortium model can unlock $100,000 to $300,000 annually per partner site through a combination of cash contributions, in-kind equipment loans, and credentialing subsidies. Frame the pitch around the Bureau of Labor Statistics (BLS) occupational forecasts for your region, showing employers a clear return on investment through reduced recruiting costs and shorter onboarding timelines.
- Map state WDB RFP calendars 12 months ahead to align Perkins budgets with upcoming grant cycles.
- Negotiate formal WIOA Title I youth co-enrollment agreements to layer an additional $3,500 per participant onto existing programs.
- Structure employer consortium MOUs with measurable talent pipeline commitments, not just generic sponsorship language.
- Diversify across at least three funding streams to protect against any single federal or state appropriation cut.
Grant Writing Tactics That Win Approval in State Perkins V Competitions
Winning a slice of the roughly $1.4 billion in annual Perkins V funding that flows to state administrators requires more than a compelling story. Reviewers grade every line of a proposal against a published state scoring rubric, and the proposals that score highest are the ones that read like a mirror reflection of that rubric. The smartest grant writers in the country treat the state RFA (Request for Applications) document as a blueprint, not a guideline, and they structure every paragraph to satisfy an explicit indicator, performance measure, or equity clause before a reviewer has to hunt for it.
Aligning Proposal Narratives with State-Determined Core Indicators
Under Perkins V, each State Perkins Plan defines the specific core indicators that drive competitive scoring. The federal law identifies the broad categories (concentrator graduation, technical skill attainment, post-program placement, non-traditional program enrollment, and credentials of value), but states adjust the weights and definitions every year. A proposal that talks about “improving graduation rates” in the abstract scores poorly. A proposal that opens with the state’s exact indicator language, cites the most recent state performance gap from the published annual report, and then proposes a measurable closure strategy scores at the top of the rubric. Reviewers can literally check the box.
Strong applicants also embed their logic models directly into the narrative. They map every activity to a specific core indicator, name the data source (the state’s Perkins management information system, school transcripts, WIOA Title I records, NCCT certifications), and state the projected improvement numerically. For example: “This consortium will increase the concentrator technical-skill attainment rate from 71.2% (state 2024 baseline) to 79.0% by Year 2 by embedding Precision Exams assessment checkpoints at the end of each intermediate course.” That sentence hits the indicator, the baseline, the target, the intervention, and the assessment in one breath.
Demonstrating Equitable Access for Underrepresented Student Populations
The non-traditional participation indicator is where many proposals quietly fail. State reviewers are looking for explicit, documented strategies to recruit and retain students in CTE programs that lead to occupations where their gender has historically represented less than 25% of the workforce. Generic language about “welcoming all students” no longer earns points. Winners describe specific recruitment pipelines (middle-school visits, Girls in Trades camps, HOSA partnerships), named barrier-removal supports (transportation stipends, childcare for teen parents, dual-language enrollment forms), and quarterly disaggregated enrollment targets. Tying these commitments to the district’s US Department of Education civil rights data and to local community input from a named partner (a tribal education committee, a NAACP chapter, a community-based organization) demonstrates the kind of authentic engagement that high-scoring proposals carry.
Budgeting for Equipment, Instructor Stipends, and Student Stupends
Budgets are the section where well-meaning proposals most often get flagged as “weak, but allowable.” Reviewers want to see a one-to-one connection between the budget line items and the activities described in the narrative. A line item for $45,000 in industrial welding simulators is weak on its own. The same line item, attached to a narrative paragraph explaining how the simulators will increase the number of concentrators who sit for an AWS D1.1 credential in Year 1, is strong. The same principle applies to instructor stipends. State rubrics reward professional development that is job-embedded and credential-linked, so budget lines should fund industry-recognized certifications (PMI, NATEF, ServSafe) rather than generic conference travel.
Student supports travel under a different scoring lens. Stipends for work-based learning (transportation, meals, childcare) are highly competitive points when they are tied to a retention strategy and documented as a need based on a local poverty or transportation study. Funded applicants frequently allocate between 5% and 15% of the total request to student support stipends, with a clear per-student cap (often $300–$500 per work-based learning term) and a verification plan signed by the participating employer. Equipment lines should always include vendor quotes, a three-year maintenance plan, and a justification of why the equipment is required for an industry-recognized credential listed on the state’s approved credential list.
Final Polish: The Three Reviewer Habits to Write For
Before submission, run the proposal through three filters that match reviewer behavior. First, can a reviewer find the required elements (need, narrative, budget, evaluation, sustainability) inside the first two pages of each section? Second, does the executive summary stand alone as a one-page narrative a state-level decision maker could read in three minutes and still score the proposal? Third, are all required attachments (indirect cost rate agreements, signed MOUs with employer partners, MOUs with postsecondary partners for the strengthening career and technical education transition, letters of support) attached and dated? Proposals that satisfy these habits typically land in the top scoring band, even before the merits are debated in the state review meeting.
Navigating ABET and AACSB Connections for Advanced Career Pathways
For ambitious high schoolers eyeing six-figure futures, the leap from a secondary classroom to a high-paying technical or business career often feels like a canyon. Fortunately, the bridge is already under construction, built from stackable credentials, formal articulation agreements, and the rigorous validation of national accreditors. By intentionally aligning CTE programs with postsecondary accreditation standards, schools transform a scattered collection of elective courses into a powerful, ROI-driven talent pipeline.
Stackable Credentialing Into ABET-Accredited Engineering Technician Roles
The Accreditation Board for Engineering and Technology (ABET) sets the global gold standard for engineering and engineering technology education. When a high school CTE program maps its curriculum directly to ABET student outcomes, graduates arrive at community colleges or technical schools with a massive head start. Imagine a student earning an OSHA 30 certification, a SolidWorks Associate credential, and an IT Fundamentals certificate before walking across the graduation stage. Each credential is a modular “rung.” Earning them sequentially allows a learner to step into an engineering technician role—a field where the U.S. Bureau of Labor Statistics reports a median salary hovering near $60,000 to $70,000 per year—while pursuing an associate degree part-time. Under Perkins V, districts receive bonus funding for these nontraditional, sequenced pathways because they demonstrably move students into the workforce faster.
Building Articulation Agreements With AACSB Business Program Feeder Schools
While engineering has ABET, the business world trusts the Association to Advance Collegiate Schools of Business (AACSB). Roughly 5% of the world’s business programs earn this elite accreditation, making it a powerful magnet for ambitious students. Forward-thinking high schools are now signing official articulation agreements with nearby AACSB feeder institutions, guaranteeing that dual-enrollment credits transfer seamlessly. A junior completing a year of high school accounting and business management doesn’t have to repeat Intro to Finance in college. The credits transfer automatically, saving a family roughly $400 to $800 per semester in tuition while accelerating degree completion. This alignment ensures the high school experience mirrors the exact academic rigor an AACSB program demands, eliminating remediation costs for both students and universities.
Leveraging Accreditation Standards to Validate Program Rigor for Employers
Ultimately, employer buy-in dictates whether a CTE pathway pays off. When local manufacturers, accounting firms, and tech startups see that a high school’s curriculum mirrors ABET or AACSB frameworks, their risk in hiring young talent drops significantly. It signals that graduates possess the math fluency, communication skills, and technical competencies the modern economy demands. Schools can proudly promote this alignment in grant applications, directly strengthening their competitive edge for federal Perkins V nontraditional funding and securing lasting community partnerships.
Metrics That Justify Continued Investment in Work-Based Initiatives
Securing Perkins V funding once is an achievement. Locking in recurring allocations year after year requires a deliberate, data-driven strategy that speaks the language of federal reviewers. The Strengthening Career and Technical Education for the 21st Century Act ties roughly $1.4 billion in annual state grants directly to measurable student outcomes, meaning administrators who treat accountability as an afterthought quickly find their budgets slashed. The Perkins V blueprint demands proof, not promises.
Tracking Concentrator Graduation and Post-Program Placement Rates
The federal definition of a “CTE concentrator” carries real weight: a student who completes at least two courses within a single career pathway. State accountability submissions to the US Department of Education must show that these concentrators graduate, earn industry-recognized credentials, and land somewhere meaningful within six months of finishing their program. Top-performing districts routinely push placement rates above 85%, combining postsecondary enrollment, military service, and qualifying employment into a single composite indicator.
Districts should build dashboards that segment outcomes by pathway, demographic group, and special population status. The Perkins V statute specifically calls out equity gaps, so disaggregated data often determines whether a grant reviewer flags your application or fast-tracks it for approval. Remember that the core indicators include graduation rate for CTE concentrators (4S1), academic proficiency in reading and math (4S2 and 4S3), post-program placement (5S1), and nontraditional participation (5S3). Missing any of these triggers automatic corrective action plans.
Measuring Wage Outcomes Against Regional Labor Market Information
Salary data transforms a good CTE program into a federally fundable one. Administrators must benchmark post-program wages against Bureau of Labor Statistics Occupational Employment Statistics for the relevant Metropolitan Statistical Area, then demonstrate that completers enter occupations aligned to their training. A welding concentrator earning $52,000 in a region where the median welder makes $48,500 tells a compelling story.
Use wage data from the state’s wage record exchange, often routed through the Department of Labor’s UI system, to capture second-quarter and fourth-quarter earnings post-exit. Cross-reference these figures with projections from the state workforce development board to confirm pathway alignment with high-demand sectors. When completers earn above the regional median, the return on investment becomes nearly impossible for legislators to ignore.
Calculating Return on Investment for Employer-Partner Engagement
Employer partners want to see their own ROI before committing paid work-based learning slots. Calculate the cost-per-placement by dividing total program expenditures by the number of students who completed a meaningful work-based learning experience. Then compare that figure against projected lifetime earnings gains for participants, often estimated using College Board and state labor data showing first-year earnings premiums of $4,000 to $9,000 for credentialed CTE completers versus non-completers.
Track secondary indicators that resonate with chief executive officers and human resources directors:
- Pipeline conversion rate: the percentage of interns transitioning to full-time roles within twelve months.
- Training cost avoidance: dollars saved by employers when CTE programs handle pre-employment instruction.
- Retention benchmarks: two-year retention of program hires versus industry averages.
- Diversity contribution: placement of women and minority students into nontraditional fields, which directly supports Perkins V’s equity goals.
Present these metrics in a format familiar to project managers and corporate decision-makers, such as the balanced scorecard or a cost-benefit ratio aligned with PMI project management standards. When employer-partner ROI documentation is airtight, securing matching commitments and in-kind contributions becomes routine rather than aspirational.
| Funding Pathway | Eligible Recipients | Required Local Match (US Dollars) | Core Accountability Metric | Implementation Timeline |
|---|---|---|---|---|
| Perkins V Basic State Grant | Local K-12 CTE Programs / Community Colleges | $0 (No local match required, but maintenance of effort applies) | 90% CTE Concentrator Graduation Rate | Annual State Plan updates |
| Perkins V Non-Traditional Careers | Secondary / Postsecondary Institutions | Cost-share varies by State (avg. ~$50,000) | Non-traditional gender enrollment growth | 4-Year State Plan cycle |
| Perkins V Innovation Grant | Eligible Postsecondary / Consortiums | 50% Match ($1 Local : $2 Federal) | Postsecondary Transition & Credential Attainment | 2-3 Year Project Cycles |
| Perkins V Corrections Education | State Correctional Agencies / LEAs | $0 Federal Threshold Match | Re-entry employment placement (90 days post-release) | Annual Performance Review |
Frequently Asked Questions
What is Perkins V funding and how much money does it provide?
Perkins V is the Strengthening Career and Technical Education for the 21st Century Act, signed in 2018. It authorizes roughly $1.4 billion in annual federal funding distributed by the U.S. Department of Education to state CTE directors, who then allocate dollars to local high schools and postsecondary institutions for career-connected learning programs.
Who is eligible to receive Perkins V CTE grants?
Eligible recipients include local educational agencies (LEAs), K-12 school districts operating CTE programs, community colleges, technical schools, state correctional institutions, and consortiums. Recipients must design programs meeting Perkins V accountability metrics for workforce readiness.
What are the core accountability metrics under Perkins V?
Perkins V mandates strict accountability tied to real-world student outcomes, including a 90% CTE concentrator graduation rate, postsecondary transition success, credential attainment, non-traditional career enrollment growth, and re-entry job placement for corrections-involved students within 90 days post-release.
Do schools need a local match to secure Perkins V funding?
Most Perkins V Basic State Grants require no local dollar-for-dollar match, though states must maintain funding effort. However, Perkins V Innovation Grants typically require a 50% local match, meaning institutions contribute $1 for every $2 in federal funding received.
How do high schools apply for Perkins V workforce pipeline funding?
High schools apply through their state's approved Perkins V plan, submitted to the U.S. Department of Education. State CTE directors release competitive application timelines annually, requiring districts to align program proposals with state-determined workforce readiness benchmarks.
Strategic Final Takeaway
When evaluating Career Connected Learning High School Models Work Based Learning Funding Grants Perkins V, base your decisions on accredited institutional standards, measurable return on investment (ROI), and up-to-date official guidelines. Always verify specific dates and requirements through official regulatory portals.