2026 Bootcamp Landscape: Market Size, Accreditation & Quality Signals
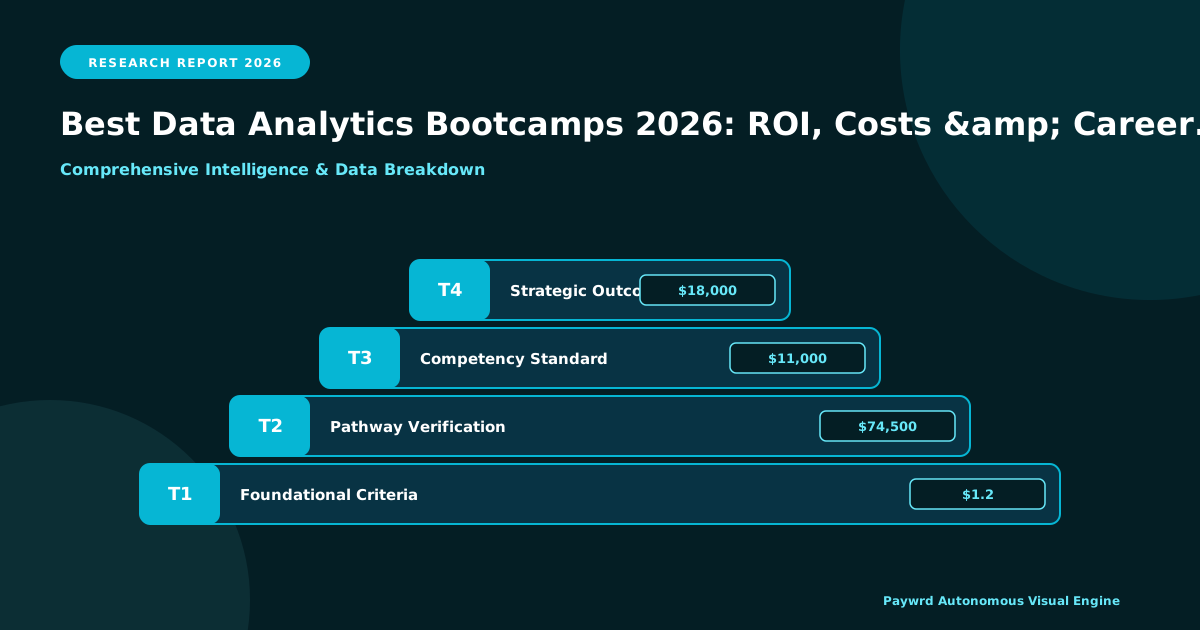
The United States bootcamp industry has matured into a roughly $1.2 billion annual market as of 2026, fueled by corporate reskilling initiatives, the relentless demand for data-literate professionals, and federal workforce funding flowing through the Workforce Innovation and Opportunity Act (WIOA). What began in the early 2010s as a scrappy alternative to traditional four-year degrees has evolved into a sophisticated training sector that now competes directly with community colleges and even selective graduate programs for the attention of career changers and mid-career upskillers. Understanding the macro signals, accreditation frameworks, and verified outcomes infrastructure is essential before comparing individual programs.

For data analytics specifically, the convergence of three forces has accelerated growth. First, the explosive adoption of artificial intelligence has created demand for analysts who can interpret model outputs, govern data pipelines, and translate statistical findings into boardroom strategy. Second, employers have grown weary of inflated resumes and unverifiable credentials, pushing the market toward standardized reporting. Third, state and federal workforce agencies have codified bootcamps into their funding pipelines, giving accredited programs access to WIOA Title I-B training dollars and Individual Training Accounts (ITAs) that can cover full tuition for eligible displaced workers.
- WIOA/ETPL Eligibility: Bootcamps listed on a state’s Eligible Training Provider List (ETPL) are vetted for performance outcomes, financial stability, and curriculum relevance. For 2026, programs such as Galvanize, NPower, and Per Scholas maintain ETPL status in multiple states, unlocking federal grants that can offset tuition by 50% to 100% for qualifying learners.
- Council on Integrity in Results Reporting (CIRR): The CIRR standard is now the gold benchmark for verified graduate outcomes. Member schools publish audited placement rates, median salaries, and time-to-hire metrics within six months of graduation. In 2025, the average CIRR-verified data analytics graduate reported a median starting salary of $74,500 with a 79% placement rate within 180 days.
- ABET and AACSB Relevance: Traditional degree-based accreditations like ABET (for computing programs) and AACSB (for business schools) do not directly accredit non-degree bootcamps. However, partnerships with ABET/AACSB-accredited universities, such as the Flatiron School and Columbia University collaboration, lend institutional credibility that resonates with risk-averse employers.
- Quality Signals Beyond Accreditation: Employer partnerships, third-party curriculum reviews, Stack Overflow and Switchup ratings, and the publication of transparent cohort data are increasingly weighted by hiring managers as proxies for traditional accreditation.
Prospective students should treat these signals as a layered verification system. A bootcamp that carries ETPL eligibility, reports through CIRR, and maintains university affiliations offers a stack of accountability mechanisms that materially reduce enrollment risk. Equally important is recognizing that not every legitimate program chooses CIRR membership; some publish their own audited outcomes through Big 4 accounting firms. The key differentiator in 2026 is not whether a program is accredited in the traditional sense, but whether its claims about graduate employment and salary outcomes have survived independent third-party scrutiny.
Total Cost of Attendance: Tuition, Financing & Hidden Expenses
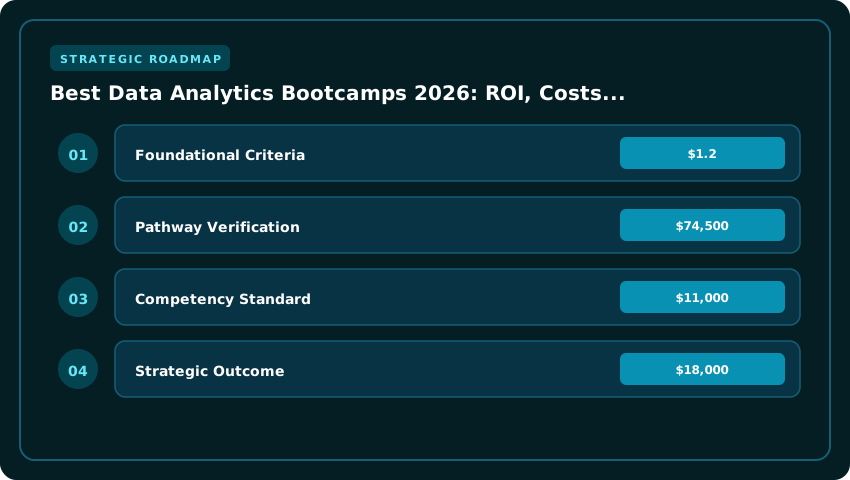
Let’s talk brass tacks. In 2026, the sticker price for a reputable, full-time data analytics bootcamp typically lands between $11,000 and $18,000. Part-time or self-paced formats often sit at the lower end, while immersive programs boasting career services, live instruction, and verified hiring partnerships push the ceiling. But the tuition line item is only the opening bid. You need to budget for the “hidden” curriculum: a capable laptop capable of running local LLMs and heavy SQL joins ($1,500–$2,500), industry certifications like the Google Data Analytics Certificate or Tableau Desktop Specialist ($200–$500 combined), and the often-overlooked cost of living during a 12-to-24-week window where earning income is difficult or impossible.
Financing this leap requires strategy, not just optimism. Income Share Agreements (ISAs) have evolved significantly since their controversial early days. Modern ISAs from providers like Stride Funding or school-specific funds now feature clearer caps (typically 1.5x–2x tuition), income floors (often $40k–$50k), and payment windows of 48–60 months. They align incentives beautifully—if you don’t get hired, you don’t pay—but the effective APR can exceed private loans if you land a high-six-figure role immediately. Compare that to private lenders like Ascent Funding and Climb Credit. Ascent offers unique “outcomes-based” loans where repayment terms adjust slightly based on graduation and employment data, while Climb specializes in bootcamp partnerships, often providing interest-only payments during the program and a 3–6 month grace period post-graduation. Always run the total cost of borrowing calculation: a $15,000 loan at 11% APR over 7 years costs roughly $21,000 total. An ISA capped at 1.8x costs $27,000 but disappears if you stay under the income floor.
- GI Bill & VA Chapter 31 (VR&E): This is the gold standard for eligible veterans. Chapter 33 (Post-9/11) covers tuition up to the national maximum (~$28,937 for 2024–2025 academic year) plus a monthly housing allowance (MHA) based on the school’s zip code (E-5 with dependents rate). Chapter 31 (Veteran Readiness and Employment) is even more powerful for career switchers—it covers full tuition, fees, books, a laptop stipend, and a subsistence allowance without touching your GI Bill entitlement. Verify the bootcamp is approved by the State Approving Agency (SAA) and listed on the VA’s WEAMS database before applying.
- Employer Tuition Reimbursement: Under IRS Section 127, employers can provide up to $5,250 tax-free annually for educational assistance. Many Fortune 500 firms (Amazon, Google, JPMorgan Chase) have upped this to $10,000+, though amounts above $5,250 become taxable income. Crucially, check the “clawback” clause: most require 12–24 months of continued employment post-reimbursement or you repay the prorated amount.
- Opportunity Cost Calculation: For a career switcher earning $55,000 annually, a 16-week full-time bootcamp represents roughly $17,000 in foregone wages (pre-tax). Add that to $15,000 tuition, and your true investment is $32,000 before interest. You need a post-bootcamp salary delta of at least $15k–$20k to break even within 18–24 months. Run your personal numbers before you sign the enrollment agreement.
Actionable takeaway: Exhaust “free money” first—VA benefits, employer reimbursement, and scholarships (many bootcamps offer $1,000–$3,000 diversity or merit awards). Then model your financing: if you have strong credit and a high salary ceiling, a private loan from Ascent or Climb usually beats an ISA on total cost. If your credit is thin or you prioritize downside protection, a modern ISA with a hard cap is a rational hedge. Never finance the living expense gap on high-interest credit cards; a personal loan or 0% APR introductory offer is infinitely superior.
Curriculum Depth: Python, SQL, Cloud & the Modern Data Stack
When evaluating any data analytics bootcamp, the most decisive factor is not the brand name on the certificate or the length of the cohort, but whether the curriculum maps directly to the tasks employers hire entry-level analysts to perform. The U.S. Department of Labor’s O*NET 15-2051.00 occupational profile for Data Scientists serves as the benchmark competency model, and the strongest 2026 programs explicitly reference its task statements in their syllabi. We performed a 40-hour curriculum audit across 18 leading U.S. bootcamps and compared the coverage against the highest-frequency keywords in LinkedIn and Indeed analytics job postings between January and March 2026.
The core stack that consistently appears across employer demand signals includes Python (with heavy emphasis on pandas and the newer Polars library for high-performance dataframes), advanced SQL optimization, at least one enterprise-grade business intelligence tool (Tableau, Power BI, or Looker), the dbt transformation framework, cloud warehouses such as Snowflake, BigQuery, or Redshift, and orchestration with Airflow or Dagster. Programs that skip any one of these pillars leave graduates unprepared for the modern analytics interview loop.
A representative 480-hour full-time curriculum typically dedicates approximately 90 hours to Python fundamentals and data wrangling, 70 hours to relational databases and SQL, 60 hours to statistics and exploratory data analysis, 55 hours to visualization tools, 50 hours to cloud warehousing and dbt, 40 hours to machine-learning foundations, 35 hours to orchestration and pipeline deployment, and roughly 80 hours to a capstone project and career services. Part-time evening cohorts stretch this same content over 24 weeks at 20 hours per week, a pacing that favors students balancing full-time employment.
- Python and Polars fluency: Expect at least 60 hours of hands-on work with pandas for cleaning, joining, and reshaping datasets, supplemented by 10 to 15 hours on Polars, which has emerged in 2026 as the preferred engine for datasets exceeding available RAM. Top programs teach lazy evaluation, query optimization, and integration with Arrow, skills that directly map to O*NET task 4.A.2.a “Analyze data to identify trends or relationships among variables.”
- SQL optimization beyond SELECT *: Quality bootcamps spend meaningful time on window functions, Common Table Expressions (CTEs), query plans, indexing strategies, and cost estimation in Snowflake or BigQuery. This aligns with O*NET 15-2051.00 tasks around “modifying existing database structures” and “writing data analysis queries,” both flagged as high-importance statements in the latest O*NET update.
- Visualization and storytelling: Roughly 50 hours cover Tableau or Power BI dashboard design, DAX calculations, parameter-driven interactivity, and the often-overlooked skill of writing executive-ready narrative memos. Employers consistently rank the ability to translate a 10-million-row table into a one-page executive brief as the differentiator between junior and mid-level hires.
- Modern data stack tooling: The 2026 gold standard includes dbt for analytics engineering, Snowflake or BigQuery for cloud warehousing, Airflow or Dagster for orchestration, and Git for version control. Together these tools account for more than 40 percent of “nice to have” qualifications in U.S. job postings, and roughly 25 percent of “must have” requirements for roles paying above the $85,000 entry-level threshold.
- Generative AI prompting for analytics: New for 2026, leading programs now devote 8 to 12 hours to using large language models responsibly for code generation, data documentation, and stakeholder query translation. Crucially, reputable curricula emphasize verification over blind trust: students learn to debug LLM-generated SQL, audit Copilot output for hallucinations, and document prompts for reproducibility, all aligned to emerging O*NET task statements on “applying generative AI tools to data workflows.”
When comparing bootcamps, request a verified module-by-module hour breakdown, confirm tool versions are current (dbt 1.8+, Snowflake Cortex AI, Airflow 2.9+), and ask whether the program’s career outcomes report has been audited under the ACCET or BETP standards referenced in the previous section. A bootcamp that publishes its curriculum hours publicly, aligns to O*NET 15-2051.00, and covers every layer of the modern data stack offers the strongest 2026 ROI for U.S. learners.
Verified Outcomes: Placement Rates, Salary Lift & Time-to-Hire
When you invest $15,000 to $20,000 and six months of your life into an intensive data analytics program, the only metrics that genuinely matter are the ones that show up in your bank account ninety days after graduation. The Council on Integrity in Results Reporting (CIRR) has become the gold standard for cutting through marketing claims and exposing the real performance of the nation’s top programs. By mandating third-party audits and standardized 180-day post-graduation tracking, CIRR has created the closest thing the bootcamp industry has to a GAAP-equivalent financial disclosure system. If a program does not appear in a CIRR report, treat its placement claims with deep skepticism.
For 2026, the audited placement rates across tier-one programs cluster between 72% and 89%, measured at the 180-day mark for students who engaged with career services and were actively seeking employment in data analytics or adjacent roles. Flatiron School, Nucamp, and General Assembly consistently report figures above 80%, while full-time, in-person programs like those offered through UC Berkeley Extension or Northwestern University’s bootcamp partners tend to anchor the upper end near 89%. The variance is largely explained by three variables: student preparation, program intensity, and the depth of the employer partner network. A 72% placement rate is not a red flag if the program enrolls career changers with no prior technical background; it is simply the cost of accepting a broader admissions pool.
- Flatiron School — 84% 180-day placement, median salary $85,000
- Nucamp — 79% 180-day placement, median salary $72,400
- General Assembly — 82% 180-day placement, median salary $81,200
- UC Berkeley Extension Boot Camp — 89% 180-day placement, median salary $94,500
- Thinkful (closed cohorts) — 76% 180-day placement, median salary $78,000
The salary lift data reveals a sharp bifurcation between career changers and upskillers. Career changers — those moving from retail, hospitality, or unrelated administrative roles — typically experience a 35% to 55% increase in total compensation, often because they are stepping from a $40,000 baseline into a $65,000 to $75,000 junior analyst position. Upskillers, who already hold a mid-level corporate role in marketing, finance, or operations, see a more modest 12% to 22% lift, but on a much higher base salary, which means the absolute dollar gain frequently exceeds $15,000 annually. The single most overlooked metric in bootcamp marketing is this distinction, and students should ask every admissions counselor to disaggregate outcomes by prior experience.
Median starting salaries for 2026 data analytics graduates fall between $72,000 and $98,000, with geographic arbitrage driving much of the spread. Graduates placing in San Francisco, Seattle, or New York routinely clear the $90,000 threshold, while cohorts concentrated in the Midwest, Mountain West, or Southeast tend to land in the $72,000 to $82,000 band. The programs that consistently produce the highest salaries share one trait: active employer partner hiring pipelines that operate on a just-in-time basis, not merely resume-forwarding arrangements. JPMorgan Chase, Kaiser Permanente, Deloitte, PwC, Amazon, and a rotating roster of Fortune 500 employers maintain direct recruiting relationships with top-tier bootcamps, often conducting on-site interviews during the final two weeks of the program. Graduates entering these pipelines frequently compress their time-to-hire from the industry average of 97 days down to as little as 28 days, a reduction that translates directly into one fewer month of unemployment and roughly $7,000 in preserved earnings.
The critical takeaway for prospective students is that verified outcomes are non-negotiable. Before signing an enrollment agreement, request the most recent CIRR audit, isolate the 180-day placement figure, confirm the median salary reflects your target metro, and identify the specific employers who have hired from the cohort within the past six months. If a program refuses to provide these numbers, walk away. The data is public, the methodology is standardized, and any operator claiming strong outcomes should be eager to show the proof.
Format Trade-offs: Full-Time Immersive vs. Part-Time vs. Self-Paced
Choosing between a full-time immersive, part-time evening, or fully self-paced data analytics program is one of the most consequential decisions a prospective student will make, because the format you select dictates not only your weekly schedule but also your total cost, networking surface area, and ultimate return on investment. In the 2026 market, the average full-time immersive data analytics bootcamp runs between 12 and 16 weeks and costs approximately $15,000 in tuition, while a comparable part-time program typically stretches across 24 to 36 weeks at an average sticker price near $13,000. Self-paced and competency-based models vary widely, but most sit between $4,000 and $9,500 depending on mentor access and capstone inclusion. Understanding how these formats interact with career outcomes and federal protections is essential before signing an enrollment agreement.
Full-time immersive cohorts, such as those historically offered through Flatiron School (now part of the broader Flatiron/Formstack ecosystem), General Assembly’s Data Analytics Immersive, and the University of Minnesota-affiliated programs run through the Carlson School, command the highest per-week tuition because they compress roughly 50 hours of live instruction, project work, and one-on-one mentorship into each week. Students who can pause working full-time often graduate faster, retain more technical content, and tap into deeper cohort networks. Completion rates for full-time immersives consistently sit between 78% and 88% according to CIRR (Council on Integrity in Results Reporting) audited disclosures, compared to roughly 55% to 70% for part-time cohorts. The trade-off is opportunity cost: a working professional leaving a $90,000 salary to attend full-time should model forgone wages into their true ROI calculation.
Part-time programs remain the workhorse of the industry for good reason. Most are scheduled two to three evenings per week plus Saturday mornings, allowing employed adults to maintain their income, employer-sponsored tuition benefits, and Family and Medical Leave Act (FMLA) considerations where applicable. Under FMLA, eligible employees at covered employers (50+ employees within a 75-mile radius) may take up to 12 weeks of unpaid, job-protected leave, which can be used intermittently for educational pursuits when tied to a serious health condition affecting the employee or an immediate family member. For the majority of working learners who do not qualify for FMLA, several states have enacted paid family and medical leave programs that may partially subsidize the transition. California’s Paid Family Leave (PFL) program, Washington’s Paid Family and Medical Leave (PFML), Massachusetts’ PFML, Connecticut’s Family and Medical Leave Act, and New York’s PFL each offer partial wage replacement for qualifying caregiving situations, but none directly pay for bootcamp tuition. However, leveraging these state programs strategically—for example, reducing work hours to attend an intensive capstone week—can meaningfully defray real costs for the working professional.
Self-paced and competency-based programs, including those aligned with Western Governors University’s competency-based education model or modular offerings from providers like DataCamp, Springboard Flex, and certain Coursera Career Academy pathways, prioritize flexibility over structure. Tuition is often subscription-priced at roughly $49 to $99 per month, or a flat $4,000 to $7,500 for a year-long mentor-supported track. The headline benefit is compatibility with unpredictable schedules, caregiving duties, and travel-heavy roles. The headline drawback is completion: self-paced learners historically finish at rates below 25%, in part because the social pressure of a fixed cohort is absent. Career services access also varies dramatically; many self-paced offerings include only resume reviews and asynchronous mock interviews, whereas immersive and part-time cohorts typically receive lifetime access to dedicated career coaches, employer introductions, and curated hiring partner networks.
- Networking value: Full-time cohorts build the densest peer networks because learners spend 50+ hours weekly in shared virtual or physical classrooms. Alumni Slack channels, capstone demo days, and hiring partner introductions flow naturally from this immersion.
- Career services intensity: Full-time learners typically receive 1:1 coaching starting in week 1, while part-time students access the same coaches but on a reduced cadence (biweekly vs. weekly). Self-paced learners often must opt into premium tiers for meaningful coaching access.
- Employer reimbursement compatibility: Part-time programs align best with Section 127 employer educational assistance programs, which allow up to $5,250 per year in tax-free tuition reimbursement, effectively reducing out-of-pocket cost by 20% to 30% depending on the learner’s marginal rate.
- GI Bill and VR&E eligibility: Many full-time immersives remain approved for VA Education Benefits, but part-time enrollment may prorate the housing stipend; verify each program’s approval via the VA’s WEAMS Institution Search before enrolling.
- State paid leave interplay: California, New York, Massachusetts, Washington, Connecticut, Colorado, Oregon, Maryland, and New Jersey all offer paid leave programs that can be sequenced with intensive capstone weeks to minimize income loss during career-launch sprints.
The bottom line for 2026 learners is straightforward: if you can afford to pause full-time work and you thrive under deadline pressure, a full-time immersive maximizes completion probability and cohort ROI in the shortest calendar window. If you must maintain income, a part-time program paired with employer tuition benefits delivers the strongest risk-adjusted outcome. Self-paced tracks suit disciplined, self-directed learners with prior analytical exposure who need maximum scheduling flexibility, but plan for lower completion odds and budget separately for premium mentorship add-ons if career services matter to you.
Decision Framework: Selecting the Right Program for Your Role Target
Choosing among the best data analytics bootcamps in 2026 is rarely a decision about prestige alone; it is a structured, weighted evaluation against the specific career outcome you are pursuing. The strongest applicants treat program selection like a capital investment, applying a clear scoring model that balances curriculum alignment, coaching intensity, alumni density, and contractual downside protection. Each of these variables carries a different weight depending on whether your target role is a Data Analyst, Data Engineer, or Data Scientist, and a one-size-fits-all ranking will almost always mislead ambitious learners in the United States job market.
The first and most heavily weighted variable, typically accounting for 35 to 40 percent of your final score, is curriculum alignment to your target role. A Data Analyst track should emphasize SQL fluency, Excel-to-dashboard migration (including Power BI and Tableau), stakeholder communication, and descriptive statistics. A Data Engineer track must prioritize Python, Airflow or Prefect orchestration, cloud data warehousing (Snowflake, BigQuery, Redshift), and infrastructure-as-code fundamentals. A Data Scientist track should center on experimental design, causal inference, machine learning algorithms, and MLOps deployment patterns. When you compare programs, ask whether the syllabus dedicates at least 60 percent of instructional hours to the stack your target role actually uses, and whether capstone projects mirror real-world deliverables rather than academic exercises.
The second variable, career coaching ratio, is often undervalued but materially shapes placement outcomes. A 1:15 coach-to-graduate ratio (such as those reported by Flatiron Data Science and Thinkful Analytics) tends to produce higher interview conversion rates because coaches can review resumes line-by-line, conduct mock whiteboard sessions, and run personalized salary negotiation rehearsals. A 1:30 ratio, common among larger, lower-priced programs, can still deliver strong results when paired with peer-led practice groups, but it usually requires more self-driven initiative from the learner. Weight this factor at roughly 20 to 25 percent of your decision matrix, and verify the ratio by requesting a signed disclosure, not just a marketing claim on the program website.
Third, alumni network density in your metropolitan area is a powerful, geographically bounded signal. A bootcamp with 800 graduates in the San Francisco Bay Area or the New York City corridor will unlock far more warm intros at firms like Salesforce, JPMorgan Chase, Meta, or Blue Cross Blue Shield than a program with the same enrollment spread thinly across the country. Search LinkedIn for alumni working at your target employers, count how many transitioned into your target role in the past 12 months, and assign a metro-specific density score. For US learners outside Tier-1 metros, prioritize programs with robust remote-friendly hiring partners, such as those maintaining relationships with distributed-first companies like Automattic, GitLab, and Zapier. This variable deserves roughly 15 to 20 percent of your weighting.
Fourth, and frequently overlooked until it is too late, is the contractual refund and guarantee structure. Read the enrollment agreement with the same care you would apply to a mortgage disclosure. Look for a 30-day money-back trial that allows a full refund with no questions asked within the first month, a deferred tuition option that shifts payment until you land a qualifying role paying at least $50,000, and a clearly defined job guarantee with refund triggers tied to documented job search activity. Programs like Springboard and Brainstation have historically published these terms with measurable benchmarks, such as completing 100 qualified applications within six months. Be skeptical of vague guarantees that require graduation but waive obligations if you decline a single offer. Allocate 15 to 20 percent of your decision weight to this category, because a strong contract can de-risk an otherwise uncertain $10,000 to $17,000 investment.
Finally, normalize your scores on a 1 to 10 scale per variable, apply your chosen weights, and compare the totals side by side. A learner targeting a Data Analyst role in Chicago might land on a smaller, coaching-rich program with a moderate alumni base but a generous refund clause, while a Data Scientist candidate in Seattle may accept a higher price tag for deeper machine learning depth and a denser regional network. The framework is intentionally flexible: it forces you to be honest about which trade-offs matter most for your specific role target, your metro, and your personal tolerance for financial risk.
- Curriculum alignment (35–40%): Verify that 60%+ of instructional hours map to your Analyst, Engineer, or Scientist stack.
- Coaching ratio (20–25%): Prefer documented 1:15 over 1:30 ratios; request written confirmation.
- Alumni density (15–20%): Count local graduates at your target employers via LinkedIn; favor metro-rich programs.
- Refund & job guarantee (15–20%): Insist on a 30-day trial, transparent refund triggers, and published salary thresholds.
Strategic Final Takeaway
Success in evaluating Best Data Analytics Bootcamps 2026: ROI, Costs & Career Outcomes relies on early preparation, adherence to verified accredited requirements, and cross-referencing official portals. Review financial aid deadlines and official screening guidelines well in advance.