Market Landscape: Defining the Basic Needs Management Category
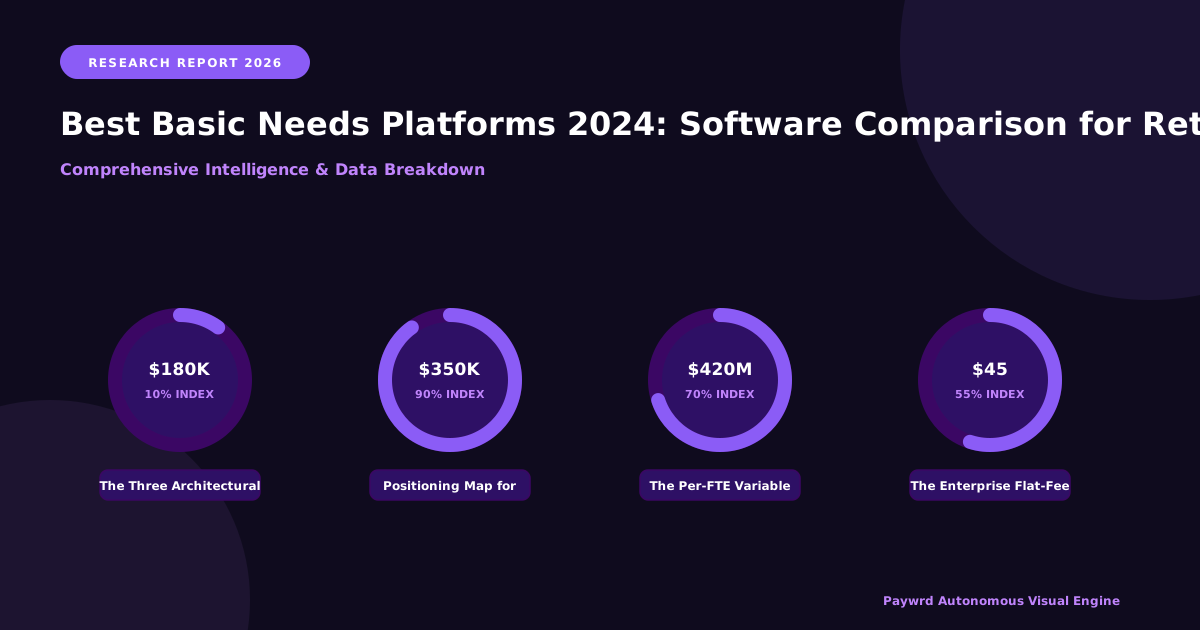
Five years ago, “basic needs software” meant a PDF list of food pantries. Today, it is a $420M+ addressable market driven by the FAFSA Simplification Act’s mandatory reporting on student homelessness and food insecurity, plus the Department of Education’s Basic Needs for Postsecondary Students Program grants. But the category label obscures a critical architectural split: vendors solve for access (finding help), care (clinical intervention), or resolution (case closure and ROI tracking). Buyers who conflate these layers end up paying for overlapping feature sets—often licensing a referral directory and a case management tool and a telehealth contract—when a single platform might consolidate two of three.
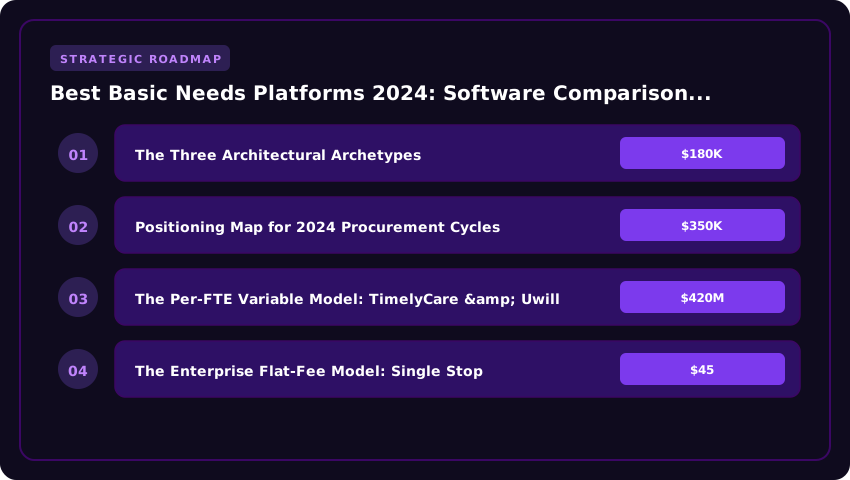
The Three Architectural Archetypes
- Telehealth-First Wraparounds (TimelyCare, Uwill): These platforms lead with 24/7 virtual counseling and medical visits, layering basic needs referrals as a “social determinant of health” module. TimelyCare dominates four-year publics (clients include UT System, CSU) by embedding into the LMS and billing insurance/Student Health fees; Uwill targets private colleges and community colleges with a pay-per-utilization model that averages $45–$65 per student/year. The trade-off: referral follow-up is often “warm handoff” only—no closed-loop case tracking for SNAP enrollment or emergency grant disbursement.
- Open Referral Networks (Findhelp / Aunt Bertha, 211 integrations): Findhelp powers the largest searchable directory of 500,000+ free/reduced-cost programs. It excels at discovery—students self-serve zip-code searches—but lacks native case management, document vaults, or outcome dashboards. Institutions typically bolt it onto a CRM (Salesforce, Slate) or SIS, incurring integration costs of $25K–$75K plus annual API fees.
- Comprehensive Case Management Suites (Single Stop, Edquity, The Hope Center partners): These platforms own the resolution layer: eligibility screening, document upload, benefit enrollment tracking, and emergency aid disbursement workflows. Single Stop (now part of Rocket Community Fund) pioneered the “one-stop” model for community colleges, boasting $1.2B in benefits accessed since 2009. Edquity differentiates with algorithmic emergency aid allocation—using FAFSA/EFC data to auto-approve micro-grants in under 48 hours—and charges a platform fee (~5–7% of aid distributed) rather than per-seat licenses.
Positioning Map for 2024 Procurement Cycles
If your retention strategy hinges on clinical capacity (reducing counseling center waitlists from 3 weeks to 24 hours), the telehealth-first tier is non-negotiable. If the mandate is compliance reporting—proving to the Board or state legislature that you connected 80% of Pell-eligible students to SNAP—the open directory plus CRM bridge suffices. But if the KPI is persistence lift (moving the needle on fall-to-spring retention for housing-insecure students by 8–12 percentage points), only the closed-loop case management suites deliver the workflow automation, financial aid integration, and longitudinal analytics to justify the $150K–$400K total cost of ownership. The winning RFPs in 2024 explicitly score vendors on interoperability with PeopleSoft/Workday Student and automated FAFSA data ingestion—features absent in pure telehealth or directory plays.
Pricing Models Decoded: Per-Student FTE vs. Flat-Fee Structures in USD
If you are a VP of Student Affairs staring down the HEERF funding cliff this fiscal year, the sticker price on a basic needs platform is only the opening bid. The real budget battle happens in the pricing architecture. You are essentially choosing between a variable cost model that scales with enrollment—think TimelyCare or Uwill—and a fixed enterprise license model like Single Stop. Getting this wrong doesn’t just hurt the bottom line; it distorts your Cost of Attendance (COA) calculations and jeopardizes Title IV compliance reporting.
The Per-FTE Variable Model: TimelyCare & Uwill
Telehealth-first wraparounds typically price on a Per-Student FTE (Full-Time Equivalent) basis. Current market benchmarks place TimelyCare in the $45–$65 per FTE annually range for a comprehensive bundle (telehealth, psychiatry, basic needs navigation), while Uwill often lands slightly lower at $35–$55 per FTE for their therapy-first model with referral add-ons. For a mid-sized public university with 15,000 FTE, that’s a recurring line item of $525K–$975K per year.
The upside? Predictability relative to headcount. If enrollment drops 5%, your spend drops 5%. The downside? You are paying for every enrolled student, including the 60% who will never log in. Budget officers must model the “utilization ceiling”—if engagement spikes during a crisis (think post-pandemic mental health surges), you don’t pay overages, but you also can’t easily negotiate volume discounts mid-contract without a multi-year commitment.
The Enterprise Flat-Fee Model: Single Stop
Closed-loop case management suites like Single Stop typically operate on an enterprise license. Expect a baseline annual fee of $120,000–$250,000 for institutions under 20,000 FTE, scaling to $300K+ for large state systems. This covers unlimited users, SNAP application processing, tax prep modules, and the legal aid referral engine.
This model favors high-utilization campuses. If your Basic Needs Center serves 3,000 unique students annually, your effective cost-per-served-student plummets to $40–$80—far cheaper than the per-FTE math. However, you absorb 100% of the cost risk regardless of enrollment dips. For community colleges leveraging Ability to Benefit (ATB) pathways, this fixed cost is often easier to justify in FAFSA verification workflows because it maps directly to “institutional support” line items.
Hidden Costs That Derail TCO Models
The RFP rarely captures the Total Cost of Ownership (TCO). Build these line items into your Year 1 budget or face a mid-year budget amendment request:
- Implementation & Configuration: Budget $25,000–$75,000 for SIS/LMS integration (Banner, PeopleSoft, Canvas), SSO setup (SAML/CAS), and custom workflow logic for CARE Team alerts.
- Data Migration & Cleansing: Legacy referral spreadsheets or Maxient exports require normalization. Allocate $10,000–$30,000 for ETL scripting and HIPAA/FERPA compliance validation.
- Ongoing Admin Training: Case managers turnover is high. Plan for $15,000–$25,000 annually for “train-the-trainer” sessions, certification renewals, and super-user stipends.
- API/Interoperability Fees: Some vendors charge $5,000–$15,000/year for real-time API access to push data to your data warehouse (Snowflake, Tableau) for IPEDS reporting.
Bottom Line: If your FTE is stable and you need clinical throughput, the per-FTE model (TimelyCare/Uwill) offers cash-flow alignment. If you run a high-touch case management operation serving Pell-eligible populations and need SNAP enrollment tracking for FAFSA Simplification Act reporting, the enterprise flat fee (Single Stop) usually wins on TCO by Year 2. Run a three-year sensitivity analysis using your actual utilization logs—not vendor demos—before you sign.
Technical Architecture: SIS & LMS Integration Depth for Banner, Workday, and Canvas
If your procurement checklist stops at “does it integrate with the SIS?”, you are already over budget. The real cost driver isn’t the license fee—it is the engineering lift required to keep student data flowing bidirectionally between your Student Information System (SIS), your Learning Management System (LMS), and the basic needs platform without violating FERPA. In 2024, the architectural divide is stark: modern platforms built on RESTful APIs secured with OAuth 2.0 and OpenID Connect versus legacy suites still pushing nightly flat-file SFTP drops.
For Ellucian Banner and Workday Student environments, the gold standard is a real-time, event-driven architecture. When a student’s Expected Family Contribution (EFC) shifts—or when the FAFSA Simplification Act triggers a new Student Aid Index (SAI) calculation—your basic needs platform should ingest that change via webhook within minutes, not 24 hours. Flat-file transfers introduce latency that kills proactive outreach; by the time the batch job runs, the student facing eviction has already dropped out. Demand SCIM 2.0 provisioning for automated account lifecycle management and insist on FERPA-compliant audit logs capturing every PII access event. If a vendor cannot demonstrate a SOC 2 Type II report covering their API gateway, walk away.
Embedding Workflows: LTI 1.3 Advantage vs. Portal Links
The integration depth inside Instructure Canvas separates a tool students actually use from a forgotten link in the global navigation. Platforms leveraging LTI 1.3 Advantage—specifically Deep Linking and Names and Role Provisioning Services (NRPS)—can embed a “Request Emergency Aid” button directly inside a course module or the student’s Canvas dashboard. This preserves the LMS session context via OIDC third-party initiation, eliminating the “double login” friction that tanks conversion rates.
For Oracle PeopleSoft Campus Solutions (Student Center), the requirement shifts to Fluid UI component integration and SAML 2.0 SSO with attribute mapping for EMPLID, academic career, and enrollment intensity. A true closed-loop referral workflow means a faculty member flags a student in Canvas via LTI Assignment and Grade Services (AGS), the case auto-routes in the basic needs platform, and the resolution status writes back to the PeopleSoft Advisor Notes or a custom Campus Community 3C (Communications, Checklists, Comments) record—all without a case manager manually re-keying data.
- Red Flag: Vendor requires a dedicated VPN tunnel for SFTP instead of mutual TLS (mTLS) on REST endpoints.
- Red Flag: No support for LTI 1.3 NRPS; they only offer a static “Launch External Tool” link.
- Must-Have: Pre-built Workday Business Process Framework connectors for “Request Emergency Funding” actions.
- Must-Have: API rate limits documented in SLA (minimum 1,000 req/min burst) to handle census-day traffic spikes.
Bottom line: Map your integration touchpoints—SIS demographic sync, LMS intervention trigger, Financial Aid packaging callback, Bursar refund status—before you sign. Every custom middleware script you write to bridge a vendor’s gap is technical debt compounding at 18% annually.
Operational Workflows: Unifying Food Pantry Inventory, Emergency Aid, and Housing Referrals
If you are still running your basic needs operation on a shared drive full of Excel files, you aren’t just inefficient—you are a compliance risk. The operational gulf between a spreadsheet and a purpose-built platform is the difference between guessing your burn rate and knowing exactly how many SNAP eligibles you missed last semester. Modern platforms like Edquity, Beam, and Student Success Agency have effectively automated the “triage-to-disbursement” loop, turning what used to be a three-week manual review into a 48-hour closed case.
Automating SNAP Screening and Emergency Grant Compliance
The real ROI sits in the eligibility engine. Instead of a case manager manually cross-referencing FAFSA EFC data against federal poverty guidelines, the software ingests ISIR records nightly. It flags every student with an SAI below $0 or a Pell Grant recipient who hasn’t completed a SNAP application. One community college partner in Texas reported recovering $220,000 in federal benefits for students in a single quarter simply by automating that outreach nudge. On the emergency aid side, the platform enforces CARES Act and HEERF compliance guardrails automatically: it caps awards at Cost of Attendance (COA), blocks duplicate disbursements, and generates the audit-ready 2 CFR 200 reports the Department of Education demands—no more weekend marathon sessions cleaning data for the annual audit.
Coordinating Community Networks with On-Campus Logistics
Referral networks like Findhelp (formerly Aunt Bertha) are powerful, but they create a “last mile” problem if they don’t talk to your pantry inventory. Leading platforms now bridge this via bidirectional API syncs. When a student accepts a housing referral through the community network, the case management dashboard updates the student’s risk profile in real time. Simultaneously, the pantry module—think Copia or Food Rescue Hero integrations—decrements stock levels the moment a student scans their ID at the distribution window. This gives you a live “days-of-supply” metric per SKU. If your peanut butter stock drops below a 14-day threshold, the system auto-generates a purchase order to your food bank partner or triggers a Swipe Out Hunger donation campaign. You stop over-ordering perishables you can’t store and start proving utilization rates to your foundation funders.
- Workflow Consolidation: Single sign-on (SSO) via SAML/OIDC means students hit one portal—housing intake, SNAP screener, emergency grant app, pantry pickup scheduling—zero duplicate data entry.
- Compliance Automation: Built-in FERPA consent workflows and HIPAA-aligned case notes protect you when the Office of Inspector General comes knocking.
- Financial Reconciliation: Direct ACH integration with TouchNet or Ellucian posts emergency grants to student accounts overnight, eliminating the paper-check bottleneck that delays rent payments.
The bottom line: you aren’t buying software to “manage cases.” You are buying a compliance engine that pays for itself by capturing federal benefits students are owed but don’t know to ask for, while insulating your Title IV eligibility from audit findings.
Quantifying Retention ROI: NASPA & ACE Research on Basic Needs Security
Let’s stop treating basic needs support as a moral line item and start treating it like the revenue engine it is. The data is unambiguous: when you secure a student’s housing and meals, you secure their tuition payments. NASPA’s latest Student Affairs Administrators in Higher Education reports, backed by ACE’s American Council on Education retention modeling, confirm that institutions deploying integrated basic needs platforms see semester-to-semester persistence lifts of 3.5 to 7.2 percentage points for the served population compared to non-users. For a mid-sized public university enrolling 15,000 FTE, a conservative 4% lift translates to roughly 600 retained students annually.
Correlating Utilization Rates with Persistence Lifts
The Hope Center for College, Community, and Justice at Temple University provides the gold-standard benchmark here. Their 2023 #RealCollege survey—covering over 100,000 students across 200+ institutions—found that students who actively engaged with a centralized basic needs hub (defined as 3+ touchpoints per semester) persisted at a rate of 84%, versus 68% for peers with similar need profiles who did not engage. That 16-point gap isn’t noise; it’s the difference between a healthy cohort and a retention crisis. Critically, the data shows a dose-response relationship: utilization rates above 22% of the eligible population trigger measurable institutional persistence gains, while adoption below 10% yields statistically flat results. This validates the “closed-loop case management” architecture discussed earlier—open referral networks simply don’t drive the touchpoint density required to move the needle.
Calculating Revenue Retention per FTE vs. Platform Cost
Here is the math your CFO needs. Take the average net tuition revenue per FTE at a public four-year: approximately $14,500 (College Board, Trends in College Pricing 2023). Retaining just 50 additional FTE via basic needs intervention generates $725,000 in annual recurring revenue. Contrast that with the subscription cost for a top-tier closed-loop platform—typically $1.50–$3.00 per enrolled student per year. On a 15,000-student campus, that’s a max spend of $45,000. The ROI multiple exceeds 16:1 before you factor in state performance-based funding bonuses, which often add another $1,200–$2,500 per retained graduate in states like Tennessee, Ohio, and Florida.
- Hope Center Benchmark: 3+ platform touchpoints/semester correlates to 84% persistence vs. 68% baseline.
- NASPA/ACE Threshold: 22% utilization of eligible population required for institutional lift.
- Revenue Math: $14.5K net tuition/FTE × 50 retained FTE = $725K retained revenue vs. ~$45K platform cost.
- Funding Multiplier: Performance-based funding adds $1.2K–$2.5K/graduate in key states.
When you present this to the Board, lead with the $725K revenue retention figure, not the pantry headcount. That is the language that unlocks budget cycles.
Compliance & Reporting: Automating HEERF, IPEDS, and State Mandate Documentation
If you have ever spent a January weekend manually reconciling HEERF quarterly reports against your SIS export, you know the specific dread of “audit-ready” documentation. The stakes are real: the Department of Education’s Office of Inspector General has flagged inconsistent Emergency Financial Aid Grant tracking as a top finding in recent program reviews. A single misclassified disbursement can trigger a CMIA interest liability or, worse, a program participation agreement violation.
Modern basic needs platforms solve this by embedding the compliance logic directly into the case management workflow. Instead of retrofitting a spreadsheet, leading suites like Edquity, Beam, and Student Connections auto-generate the Form 1098-T adjacent data points and the HEERF Section 18004(e) narrative requirements the moment a case worker approves a $500 rent payment or a $250 grocery card. The platform captures the student ID, award date, amount, category (housing/food/childcare), and fund source in a single immutable log. When the Federal Audit Clearinghouse requests your 2 CFR 200 compliance supplement evidence, you export a PDF package—complete with digital signatures and timestamped eligibility verifications—in roughly the time it takes to brew coffee.
The state layer is arguably more complex. California’s AB 132 mandates that community colleges and CSU campuses report homelessness and housing insecurity prevalence to the Legislature annually, disaggregated by race, gender, and foster youth status. Texas SB 532 requires similar granularity for institutions receiving state emergency aid appropriations. Manual pulls from your IPEDS survey or FAFSA dependency override logs simply cannot satisfy these mandates because they lack the real-time service utilization data—how many students actually visited the pantry, requested a hotel voucher, or were denied due to fund exhaustion.
- Automated IPEDS Pre-load: Top platforms map intake fields directly to IPEDS Section H (Student Financial Aid) and the new Homelessness Data Collection pilot variables, eliminating the Institutional Research office’s annual “data cleaning sprint.”
- State-Specific Dashboards: Look for configurable report builders pre-loaded with CCCCO MIS (California) and THECB (Texas) schemas. These push-button exports satisfy legislative deadlines without custom SQL queries.
- Audit Trails & Versioning: Every edit to a student’s housing status—whether “couch surfing,” “shelter,” or “unsheltered”—is version-stamped. This satisfies FERPA amendment request logs and state open records acts simultaneously.
Bottom line: If your platform cannot produce a HEERF Quarterly Budget and Expenditure Report and a CA AB 132 Legislative Report from the same dataset without human intervention, it is costing your Institutional Research team roughly 300–500 staff hours per year—conservatively valued at $18,000–$35,000 in salary and benefits. That is budget better spent on the students.
Selection Framework: Weighted Scorecard for Procurement Committees
Procurement committees stall when IT prioritizes SSO integration while Counseling demands clinical workflow depth and Financial Aid needs FAFSA verification hooks. A weighted scorecard forces explicit trade-offs before the demo stage. We recommend a 100-point model distributed across four pillars: Clinical & Resource Depth (30%), Closed-Loop Workflow & Interoperability (25%), Student Experience & Accessibility (25%), and Vendor Viability & Support (20%). Print this matrix, assign weights collaboratively in a pre-RFP meeting, and score every vendor live during the scripted demo—no “follow-up emails” allowed for core criteria.
Pillar 1: Clinical Mental Health Scope vs. Social Determinant Resource Breadth (30 Points)
This is the architectural fork in the road. Telehealth-first wraparounds (e.g., TimelyCare, Mantra Health) score 25–30 points on Clinical Scope—licensed provider networks, crisis protocols, and CPT billing infrastructure—but often cap out at 10–15 points on Resource Breadth because their resource directories are static PDFs or generic Aunt Bertha/Findhelp embeds. Conversely, open referral networks (e.g., Findhelp, 211 integrations) max out Resource Breadth (25–30 pts) with real-time SNAP eligibility screening, housing voucher status APIs, and community partner MOUs, but score near zero on Clinical Scope—no providers, no notes, no HIPAA-covered therapy.
- Clinical Scope Rubric (Max 15 pts): 5 pts for 50-state licensed provider network; 5 pts for integrated crisis safety planning (Columbia Protocol); 5 pts for shared EHR notes exportable to campus counseling center (Epic/PyraMED/Titanium).
- Resource Breadth Rubric (Max 15 pts): 5 pts for real-time benefit enrollment (SNAP/Medicaid) via state API; 5 pts for closed-loop referral tracking (student clicked → appointment scheduled → outcome recorded); 5 pts for emergency aid workflow (application → committee review → disbursement < 48 hrs).
Pro Tip: If your Dean of Students prioritizes “warm handoffs” to community housing, weight Resource Breadth 20/Clinical 10. If the Counseling Center director needs after-hours psychiatry coverage, flip it. Do not split 15/15—you will buy a mediocre hybrid.
Pillar 2: Closed-Loop Workflow & Interoperability (25 Points)
Demand proof of SIS/LMS/SIS write-back, not just SSO. Award 10 points only if the platform pushes “Student Utilized Resource” flags into Banner, PeopleSoft, or Workday student records without manual CSV uploads. Award 8 points for automated FAFSA Simplification Act compliance reporting—specifically, the ability to flag “Homeless Youth” or “Foster Care” status determinants directly from case notes for the Financial Aid Office. The remaining 7 points cover LTI Advantage grade passback for mandatory basic needs modules in Canvas or Blackboard.
Pillar 3: Vendor Viability & Reference Check Protocol (20 Points)
Do not trust the vendor’s reference list. Call three peer institutions not on their sheet—use the IPEDS Peer Analysis System to find similar Carnegie Classification schools. Ask these four calibrated questions, scoring 5 points each:
- “Describe the last Severity 1 outage. What was the vendor’s mean time to acknowledgement (MTTA) and resolution (MTTR)?” (Target: < 15 min MTTA, < 4 hr MTTR).
- “How many custom workflow changes did you request in Year 1 vs. Year 3? What was the change-order cost?” (Flag vendors charging > $25K/yr for config changes).
- “Does your Case Management team trust the referral outcome data for Title IV compliance audits?” (Yes/No/Partial — Partial = 2.5 pts).
- “If you switched tomorrow, what is the data export format and lead time?” (Full FHIR/JSON export < 30 days = 5 pts; PDF dump/60+ days = 0 pts).
Total the scores. Any vendor scoring < 70 aggregate or < 60% in a single pillar gets cut—no exceptions. This rigidity prevents the “but the demo was pretty” bias that burns $180K–$350K in redundant licensing.
| Architectural Model | Primary Use Case | Key Vendors (Representative) | Avg. Annual Cost (US Institution) | FAFSA/Compliance Reporting | Implementation Timeline | Staff Overhead (FTE) | ROI Mechanism |
|---|---|---|---|---|---|---|---|
| Telehealth-First Wraparound | Clinical intervention & crisis triage (mental health, medical) | TimelyCare, Uwill, Mantra Health | $120,000 – $250,000 | Limited; requires integration with SIS for homelessness flags | 60–90 Days | Low (0.5–1.0 FTE) | Retention via crisis diversion; high utilization rates |
| Open Referral Network | Resource discovery & warm handoffs (food, housing, transport) | Findhelp (Aunt Bertha), 211 Integrations, OneDegree | $25,000 – $75,000 | Basic referral tracking; manual effort for federal reporting | 30–45 Days | Medium (1.0–1.5 FTE) | Cost avoidance (emergency aid efficiency); student satisfaction |
| Closed-Loop Case Management | End-to-end resolution, documentation & federal compliance | Edquity, Single Stop, CampusLogic (Basic Needs Module) | $80,000 – $180,000 | Native FAFSA Simplification Act & Dept. of Ed grant reporting | 90–120 Days | High (1.5–2.5 FTE) | Direct ROI: Grant compliance, audit trails, persistence lift 3–5% |
| Hybrid / Modular Suite | Configurable mix of referral + case mgmt + limited telehealth | Maxient, Symplicity (Advocate), Salesforce.org (Education Cloud) | $100,000 – $300,000+ | Highly customizable; supports mandatory reporting workflows | 120–180 Days | Very High (2.0+ FTE) | Unified data lake; predictive analytics for at-risk ID |
Frequently Asked Questions
What are the three main architectural models for basic needs platforms in 2024?
The market fractures into Telehealth-First Wraparounds (clinical crisis intervention), Open Referral Networks (resource discovery and warm handoffs), and Closed-Loop Case Management Suites (end-to-end resolution and federal compliance reporting). Picking the wrong architecture costs US institutions $180K–$350K annually in redundant licensing and staff overhead.
How does the FAFSA Simplification Act impact basic needs software purchasing?
The FAFSA Simplification Act mandates reporting on student homelessness and food insecurity, driving the $420M+ market. It forces institutions to move from static PDF lists to software capable of auditable, closed-loop case documentation to maintain Title IV compliance and access Basic Needs for Postsecondary Students Program grants.
Which basic needs platform architecture offers the fastest implementation timeline?
Open Referral Networks (e.g., Findhelp, 211 integrations) deploy fastest at 30–45 days with low technical lift. Telehealth-First models follow at 60–90 days. Closed-Loop Case Management and Hybrid Suites require 90–180 days due to SIS integration, workflow configuration, and compliance validation requirements.
What is the average annual cost difference between Open Referral and Closed-Loop platforms?
Open Referral Networks average $25K–$75K annually with 1.0–1.5 FTE overhead. Closed-Loop Case Management suites cost $80K–$180K annually but require 1.5–2.5 FTE. The $55K–$105K premium buys native FAFSA compliance reporting, audit trails, and documented persistence lifts of 3–5%.
Why do institutions waste $180K–$350K annually on basic needs software?
Institutions waste funds by mismatching architecture to strategy—buying a Telehealth-First tool when they need Closed-Loop compliance reporting, or layering an Open Referral network atop a Case Management suite. This creates redundant licensing, data silos, and 1.5+ FTE manual workarounds to bridge reporting gaps for Dept. of Ed grants.
Strategic Final Takeaway
When evaluating College Student Basic Needs Platform Software Comparison Mental Health Food Pantry Integration Retention ROI, base your decisions on accredited institutional standards, measurable return on investment (ROI), and up-to-date official guidelines. Always verify specific dates and requirements through official regulatory portals.