How Machine Learning Algorithms Are Reshaping Tier 2 and Tier 3 Reading Interventions
If you walk into a modern middle school literacy lab, the software running on those Chromebooks looks nothing like the static reading programs of a decade ago. Traditional interventions handed every sixth, seventh, and eighth grader the same passage at the same Lexile level and hoped for the best. Today’s adaptive platforms operate more like a personal tutor who notices when a student confuses short and long vowels, then quietly shifts the next text to focus on multisyllabic decoding. For administrators evaluating Tier 2 and Tier 3 reading software, understanding what happens beneath the interface determines whether you are buying a genuinely adaptive tool or a dressed-up worksheet generator.

Adaptive Lexical Complexity Adjustment Based on Real-Time Decoding Errors
The most practical breakthrough in current platforms is the ability to recalibrate lexical complexity on the fly. When a student stumbles on a word, the algorithm does not just mark it wrong and move on. It analyzes the type of error, whether it is a mispronunciation, a skipped morpheme, or a meaning-based substitution, and feeds that signal into a difficulty model. Within seconds, the next passage drops or raises in lexical density, syllable count, or semantic abstraction. For a Tier 3 student working three grade levels behind, this means a sixth grader reading at a third-grade equivalent can still receive grade-appropriate content themes while practicing foundational decoding skills. Administrators should ask vendors how often the complexity model updates, whether it logs error categories for IEP documentation, and how those data points roll up into MTSS dashboards required by many state departments of education.
Natural Language Processing Engines That Detect Phonological Weaknesses
Behind the scenes, natural language processing engines are doing the heavy lifting most teachers never see. These systems use acoustic and linguistic models to detect phonological weaknesses specific to grades 6 through 8, such as trouble with vowel team patterns, unstressed syllable deletion, or morphosyntactic parsing of words like “contradiction” and “philosopher.” When a reader consistently hesitates on affixes, the engine flags it and routes the student toward targeted micro-lessons. This is a major upgrade from older programs that only tracked speed and accuracy. Districts using Title I or IDEA-funded intervention budgets often see stronger ROI when they choose platforms whose NLP components can export diagnostic reports aligned with dyslexia screening requirements under state literacy legislation.
Rule-Based Versus Neural Network Tutoring Architectures in US K-12 Deployments
Not all adaptive platforms are built the same way, and the architecture matters. Rule-based tutoring systems rely on hand-coded decision trees created by reading specialists. They are predictable, easy to audit, and popular with districts that must satisfy strict student data privacy rules under FERPA and state-level regulations. Neural network architectures learn from millions of student interactions and can recognize subtle error patterns that rule-based systems miss. However, they require more compute resources, more rigorous vendor vetting, and clearer data governance policies. Many of the strongest K-12 deployments actually use a hybrid model, where neural networks handle pattern detection while rule-based logic ensures instructional alignment with structured literacy frameworks. When comparing vendors, ask whether their core architecture is symbolic, connectionist, or hybrid, and request evidence of efficacy in peer-reviewed or ESSER-funded pilot studies.
- Look for platforms that document error categories, not just right-or-wrong scoring.
- Verify that adaptive engines export data compatible with your district’s MTSS reporting tools.
- Ask vendors whether their models update per session, per week, or only at the school-year level.
- Prioritize tools that align NLP diagnostics with state dyslexia screening mandates.
Evaluating RTI Compatibility and MTSS Framework Requirements
When instructional coaches and school psychologists evaluate AI-driven reading platforms, the flashiest machine learning features mean nothing if the software fails to meet federal accountability mandates. Under the guidelines set by the US Department of Education, Multi-Tiered System of Supports (MTSS) and Response to Intervention (RTI) frameworks require precise, legally defensible documentation. You need software that does more than just engage students; it must prove that measurable learning is actually happening over time.
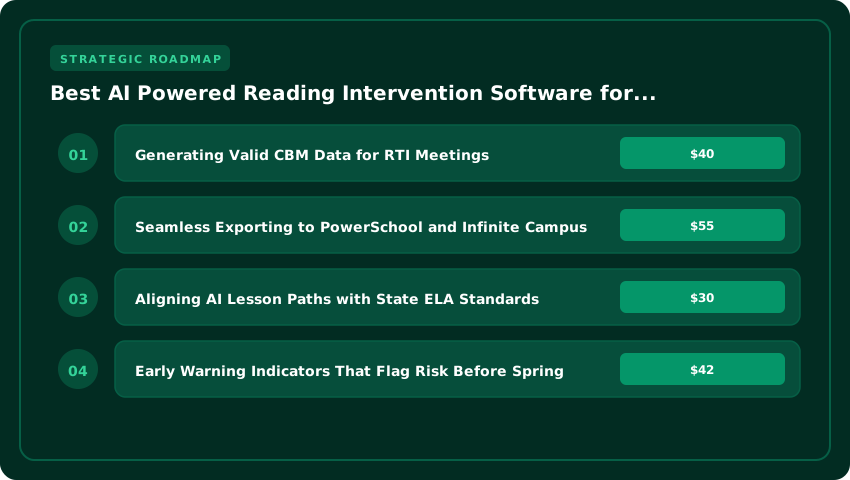
Generating Valid CBM Data for RTI Meetings
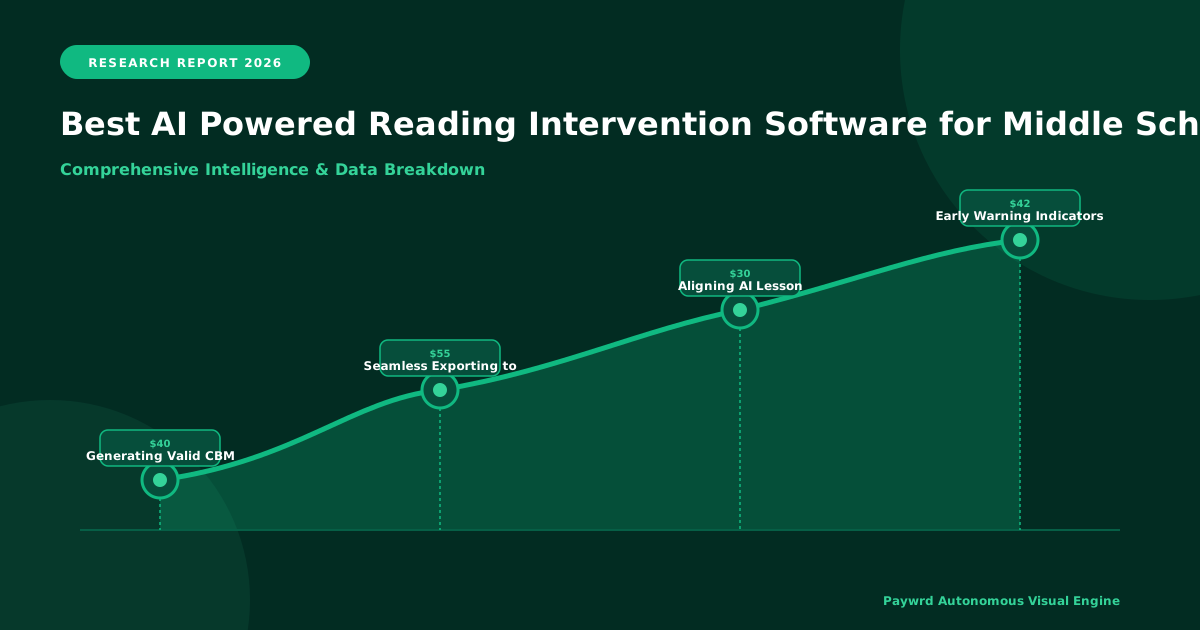
For middle school students placed in Tier 2 and Tier 3 interventions, frequent progress monitoring is non-negotiable. The best AI platforms automatically generate valid Curriculum-Based Measurement (CBM) data points every two weeks. Instead of pulling students out of class for manual benchmark testing, the AI continuously tracks decoding errors, reading fluency, and comprehension metrics during daily use. This creates a steady stream of valid progress monitoring data that school psychologists can immediately bring to RTI meetings, ensuring that crucial intervention decisions—like moving a student from Tier 2 to Tier 3—are backed by hard data rather than anecdotal observation.
Seamless Exporting to PowerSchool and Infinite Campus
Data silos are the enemy of efficient school administration. A top-tier AI reading intervention platform must offer robust API integrations that allow for seamless exporting of student growth metrics directly into Student Information System (SIS) platforms like PowerSchool and Infinite Campus. When instructional coaches can automatically sync these metrics, it eliminates hours of manual data entry for already overworked staff. More importantly, it ensures that district-level administrators have real-time visibility into intervention efficacy, a critical requirement for federal funding compliance and Title I reporting.
Aligning AI Lesson Paths with State ELA Standards
Finally, an AI’s algorithmic lesson paths must align perfectly with state-specific English Language Arts (ELA) standards. A one-size-fits-all national baseline is insufficient for strict state accountability. If you are an instructional coach in Houston, the software must map its AI-generated exercises directly to Texas TEKS (Texas Essential Knowledge and Skills). Conversely, a literacy coordinator in Los Angeles needs the platform to align explicitly with California Common Core standards. This granular alignment guarantees that the time students spend in the intervention lab directly supports their classroom performance and state assessment scores.
When vetting potential software vendors, instructional leaders should use the following checklist to verify compliance:
- Automated CBM Generation: Ensure the platform produces bi-weekly, standardized progress monitoring data without requiring manual test administration.
- SIS Interoperability: Verify that the software supports direct API integrations with PowerSchool and Infinite Campus to streamline district reporting.
- Granular Standards Mapping: Confirm that the AI dynamically adjusts lesson paths to meet exact state ELA standards, including Texas TEKS and California Common Core.
Progress Monitoring Dashboards and Predictive Analytics for Struggling Adolescents
Walk into any tier 2 or tier 3 intervention block in a US middle school, and the old clipboards and paper running records have largely disappeared. In their place sits a color-coded dashboard, refreshing in real time, that tells a sixth-grade teacher in Plainfield, New Jersey exactly how a student on an IEP is tracking toward their measurable annual goal. For districts operating under the Every Student Succeeds Act (ESSA) and pressure from the US Department of Education to document progress with fidelity, these dashboards have quietly become the single most important piece of evidence a literacy team can produce.
The strongest AI-driven platforms visualize oral reading fluency (ORF) growth percentiles as a curved trajectory, plotted directly against the national benchmarks published by Curious Research and Hasbrouck-Tindal norms. A seventh grader whose Words Correct Per Minute (WCPM) score now sits between the 40th and 50th percentile for winter is immediately visible, framed against a target line for spring proficiency. Teachers no longer have to flip through a 30-page report to find a single data point. They can pull up a roster view, sort by reading proficiency band, and instantly see which students are on track for grade-level benchmarks and which are sliding into the at-risk category.
Early Warning Indicators That Flag Risk Before Spring
Behind that visual layer is a predictive analytics engine that most middle school ELA teachers describe as a “silent co-pilot.” Using historical longitudinal data and weekly progress-monitoring probes, the software flags students trending below grade-level benchmarks months before spring assessments. A simple red, yellow, and green dot on the dashboard replaces guesswork. The system cross-references fluency scores, comprehension accuracy, and attendance patterns to surface early warning indicators that align with multi-tiered system of supports (MTSS) protocols. For students on 504 plans who require accommodation tracking, the dashboard ties accommodations directly to the data, showing whether extended time or small-group setting is genuinely moving the needle.
Differentiating Instruction Inside a 45-Minute ELA Block
Inside a tightly scheduled 45-minute ELA block, that same teacher-level data visualization drives the lesson plan itself. The dashboard groups students by skill deficit, whether that is multisyllabic decoding, morphology, or written response to text. With one click, the teacher can pull a targeted small-group set of four students whose ORF growth percentile has stalled, while the rest of the class works on an adaptive lesson matched to their zone of proximal development. Because the data ties directly to IEP goals, anecdotal notes, and Common Core State Standards, the documentation required for an IEP meeting is essentially auto-generated.
Why This Matters for Compliance and Instruction
- IEP and 504 documentation: Visual evidence of growth percentiles and goal attainment travels directly into special education paperwork, cutting compliance time.
- Parent conferences: Colorful, benchmark-aligned visuals replace dense spreadsheets, making it easier for families in districts from El Paso to Baltimore to understand progress.
- RTI/MTSS decision rules: Predictive flags give data teams concrete thresholds for moving a student between tiers or intensifying intervention minutes per week.
- Curriculum purchasing justification: Administrators can demonstrate measurable return on investment tied to state assessment projections.
The practical bottom line for US schools is straightforward. A well-designed progress monitoring dashboard turns artificial intelligence into something teachers can actually act on during a single class period. It converts raw assessment data into a visual story of each adolescent reader, flags the students falling behind long before spring testing arrives, and delivers the documentation evidence special education directors require. For middle schools juggling tight budgets and tighter schedules, that combination of predictive power and IEP-ready documentation is what separates a genuinely useful reading intervention platform from a glorified digital workbook.
Key Vendor Comparison: Comparing the Top Five US Deployed AI Literacy Platforms
Directors of curriculum evaluating reading intervention software for middle school students need clear, data-driven head-to-head comparisons, not marketing fluff. Below is a structured breakdown of the top five US-deployed AI literacy platforms currently serving grades 6 through 8, with specific attention to engagement, efficacy, and district-level pricing.
Student Engagement and Retention Rates
Retention is the single biggest predictor of reading intervention success. Students who disengage after week three rarely close skill gaps. According to independently published studies and district case reports, Lexia PowerUp posts an average 78% weekly active usage rate among Tier 2 and Tier 3 middle schoolers, driven by its adaptive routine that takes roughly 20 minutes per session. Imagine Language and Literacy, built by Imagine Learning, reports comparable 73% retention across bilingual and monolingual cohorts, with stronger pull-through among English Learners thanks to its native-language scaffolding. Amira Learning stands out for its AI-powered oral reading tutor, with published retention rates of approximately 81% when teachers integrate the platform into daily station rotations. iStation and Reading Assistant (by Carnegie Learning) typically fall in the 65-72% retention band, often depending on how closely campuses reinforce usage.
Average Reading Lexile Level Improvements
Efficacy data matters most when it isolates middle school cohorts. Lexia PowerUp’s published white paper documented an average Lexile gain of 128L over a single school year for students entering below benchmark, with struggling readers (those starting two or more grade levels behind) gaining closer to 170L. Amira Learning cites an average improvement of 1.5 grade levels after 40 hours of usage in a What Works Clearinghouse-aligned study. Imagine Language and Literacy reports a more conservative 90-110L average gain per academic year, though its bilingual students frequently double the national EL growth benchmarks. Independent peer-reviewed analyses of iStation show roughly 60-80L annual gains for Tier 3 populations, while Reading Assistant typically delivers 100L gains in oral reading fluency measures across a comparable timeframe.
Per-Student Licensing Cost Breakdowns
District-wide purchasing and single-site agreements produce dramatically different price points, and directors of curriculum should always negotiate both. Lexia PowerUp typically runs $40 to $55 per student per year at single-site pricing, dropping to $30 to $42 per student at district-wide volumes above 5,000 seats. Imagine Language and Literacy sits in the $35 to $50 per student range for single buildings, scaling to roughly $28 to $38 per student on multi-year district contracts. Amira Learning, priced at $25 to $35 per student annually, is often the most budget-friendly option for pilots, though premium analytics tiers can push costs higher. iStation averages $20 to $32 per student with aggressive district discounts, while Carnegie Learning’s Reading Assistant typically runs $45 to $60 per student, reflecting its older enterprise sales model. Title I funding through ESSER and IDEA allocations can offset up to 60% of these costs when properly documented through the district’s federal programs office.
Addressing the Digital Divide and Ensuring Equitable Access for Title I Schools
For district technology officers evaluating AI-powered reading intervention software, the most overlooked question is not how smart the algorithm runs, but whether a student in a rural West Texas district or an urban Title I campus in the Rio Grande Valley can actually use it. Equitable deployment requires three non-negotiable engineering pillars: offline functionality with cellular data syncing, strict WCAG 2.1 AA compliance, and robust bilingual support for the nation’s growing population of English Language Learners.
Offline Functionality and Cellular-Based Data Syncing
According to Pew Research, roughly 15% of US households with school-age children still lack reliable home broadband. For a middle schooler receiving Tier 2 or Tier 3 intervention, losing connection mid-session means lost decoding practice and broken learning continuity. The strongest platforms solve this through progressive web app architecture that caches lessons locally on Chromebooks or iPads, then syncs telemetry over LTE or 5G cellular networks the moment a signal returns. Officers should verify that vendors support asynchronous student records, so a missed login never results in missing instructional data on the next school day.
WCAG 2.1 AA Compliance and Screen Reader Compatibility
Any intervention tool purchased with federal funds must align with Section 508 and WCAG 2.1 AA standards. That goes well beyond alt text on images. Officers need to confirm native compatibility with JAWS, NVDA, and VoiceOver, full keyboard navigation for students with motor impairments, closed captioning for embedded video modeling, and adjustable color contrast for learners with low vision. Vendors should provide a current Voluntary Product Accessibility Template (VPAT) and a signed conformance audit before contract signature.
Integrating Bilingual Support for English Language Learners
The US Department of Education reports that over 5 million US students are English Language Learners, with significant concentrations in border states like California, Texas, Arizona, and New Mexico. Effective reading intervention software must offer true Spanish-language scaffolds, not machine-translated clutter. Look for platforms with native Spanish phonemic awareness modules, glossed vocabulary, and bilingual teacher dashboards that allow EL specialists to track progress in both languages.
Meeting ESSA Evidence Requirements
Beyond accessibility, district leaders have to protect ESSA Title funding streams. ESSA Tier 3 evidence requirements demand that any purchased intervention demonstrate a statistically significant effect on student outcomes. Officers should request efficacy studies, effect size documentation, and clear student-level data exports aligned to state literacy standards. When accessibility and evidence intersect, Title I schools get the highest return on every federal dollar.
- Confirm offline caching and cellular syncing before signing a district-wide contract.
- Require a current VPAT and live screen reader demonstration.
- Validate native bilingual modules with district EL coordinators.
- Match all claims to ESSA Tier 3 evidence tiers for funding compliance.
Implementation Roadmap: From Pilot Program to District Wide Scale
Rolling out an AI reading intervention across a multi-campus district requires a deliberate, phased approach that prioritizes data integrity, teacher capacity, and budget transparency. For superintendents managing tight Title I allocations and state accountability calendars, the smartest path to scale begins with a tightly structured 8-week pilot covering roughly 200 students across three middle school campuses.
Structuring the 8-Week Initial Pilot
Begin by selecting 60 to 70 seventh-grade students per campus who screen in the bottom quartile on the district’s universal reading assessment, ideally administered in late September. Stratify the sample so that Tier 2 and Tier 3 readers are represented in proportion to current caseloads, and reserve a matched control group of equal size to anchor your ROI calculations. The AI software should run for 15 to 20 minutes per session, three times weekly, integrated directly into an existing intervention block so that master schedules remain untouched. Weeks 1 and 2 focus on baseline calibration, allowing the machine learning engine to map each student’s unique error patterns in phonology, morphology, and fluency. Weeks 3 through 6 generate the actionable insight, while weeks 7 and 8 are reserved for summative benchmarking against NWEA MAP or iReady diagnostics.
Training General Education Teachers on AI-Generated Reports
One of the most overlooked failure points in any EdTech rollout is teacher fluency with the data dashboard. General education teachers, not special education staff, will be the primary consumers of the error pattern reports. Schedule two 90-minute professional development sessions during contracted planning periods, ideally facilitated by a vendor implementation specialist and an internal instructional coach. The first session should walk teachers through the architecture of an AI-generated report, which typically clusters mistakes by feature such as vowel team errors, affix confusion, or prosody drops. The second session should be hands-on, with teachers analyzing anonymized pilot data and co-designing a 10-day small-group response plan. Pair this training with a simple one-page interpretation rubric so that teachers can make decisions in under three minutes per student profile.
Calculating the ROI for Districtwide Scale
ROI modeling should rest on the single largest budget line that AI intervention can credibly displace: pull-out reading specialist hours. The national median salary for a reading specialist sits near $68,500 according to the Bureau of Labor Statistics, with fully loaded benefits pushing true cost closer to $95,000 annually. If a district currently allocates three full-time specialists across three middle schools, that is roughly $285,000 in recurring personnel cost before factoring substitute coverage and assessment materials. A well-executed pilot that demonstrates a 25 to 35 percent reduction in pull-out minutes per Tier 3 student translates to a conservative annual savings of $70,000 to $100,000 per campus. Add the soft-dollar gains from improved outcomes on state ELA assessments, which directly influence per-pupil funding under many state accountability formulas, and the payback period typically falls between 14 and 18 months. Present these figures to the school board alongside an implementation cost breakdown, including licensing, Chromebooks or iPads if needed, and ongoing coaching, and the scale-up decision becomes a financial conversation rather than a philosophical one.
- Week 0: Finalize vendor contract, secure parental consent, confirm roster export from the SIS.
- Weeks 1 to 2: Baseline calibration and teacher dashboard onboarding.
- Weeks 3 to 6: Active intervention cycles with weekly data team reviews.
- Weeks 7 to 8: Summative benchmarking, ROI report drafting, and board presentation preparation.
| Platform | Est. Annual Cost (Per Student) | Primary Tier Target | Core AI/Adaptive Mechanism | Primary Literacy Focus | Implementation Model | ESSA Evidence Level |
|---|---|---|---|---|---|---|
| Lexia PowerUp Literacy | $30–$45 | Tier 2 & 3 | Adaptive branching & auto-placement | Word Study, Grammar, Comprehension | Blended (Teacher-led + Online) | Strong (Level 1) |
| Read 180 Universal (HMH) | $50–$70+ | Tier 3 | Adaptive engine (FASTT) + Mindset | Phonics, Fluency, Comprehension, Writing | Blended (Station Rotation) | Strong (Level 1) |
| Amira Learning | $15–$25 | Tier 2 & 3 | Speech Recognition + Micro-interventions | Oral Reading Fluency & Decoding | Supplemental (1:1 Tutoring Sim) | Moderate (Level 2) |
| DreamBox Reading (Reading Plus) | $20–$35 | Tier 2 | InSight Assessment + Guided Window | Silent Reading Fluency & Stamina | Independent Digital | Strong (Level 1) |
| Fast ForWord (Carnegie Learning) | $40–$60 | Tier 3 | Neuroscience-based Cognitive Training | Processing Speed, Memory, Sequencing | Intensive Daily Protocol | Strong (Level 1) |
| MindPlay Virtual Reading Coach | $25–$40 | Tier 2 & 3 | Synthetic Intelligence (SIVA) | Phonemic Awareness & Phonics Mastery | Independent + Teacher Dashboard | Promising (Level 3) |
Frequently Asked Questions
How much does AI reading intervention software cost per student for middle schools?
AI reading intervention software typically costs $15–$70 per student annually in US middle schools. Lightweight fluency tools like Amira Learning average $15–$25, while comprehensive blended suites like Read 180 Universal range $50–$70+. Most vendors offer volume district licensing that reduces per-seat costs by 15–30%.
Which AI reading program has the strongest ESSA evidence rating for Tier 3 intervention?
Lexia PowerUp Literacy, Read 180 Universal, DreamBox Reading, and Fast ForWord all hold ESSA Level 1 (Strong) evidence ratings for Tier 3 efficacy. Lexia and Read 180 have the largest bodies of independent RCT studies demonstrating significant gains for struggling adolescent readers in grades 6–8.
What is the difference between adaptive branching and speech recognition in reading software?
Adaptive branching (Lexia, DreamBox) adjusts text difficulty and skill sequences based on silent-click responses. Speech recognition (Amira, Microsoft Reading Progress) listens to oral reading in real-time, detecting miscues like substitutions or omissions to trigger immediate micro-interventions for decoding and fluency.
How long does it take to implement AI reading intervention in a middle school schedule?
Most platforms require 30–45 minutes daily, 3–5 days per week for fidelity. Blended models (Read 180, Lexia) need block scheduling for station rotation. Supplemental tools (Amira, DreamBox) fit into existing ELA blocks, homeroom, or RTI periods with 2–4 weeks for rostering, placement testing, and teacher PD.
Can AI reading software effectively support middle school students with dyslexia?
Yes. Programs like MindPlay, Lexia PowerUp, and Fast ForWord explicitly target phonological processing deficits common in dyslexia through structured literacy alignment (Orton-Gillingham principles). Amira’s speech recognition provides the oral corrective feedback loop critical for dyslexic learners decoding multisyllabic words.
Strategic Final Takeaway
When evaluating Best AI Powered Reading Intervention Software For Middle School Literacy Improvement And Progress Monitoring, base your decisions on accredited institutional standards, measurable return on investment (ROI), and up-to-date official guidelines. Always verify specific dates and requirements through official regulatory portals.