2026 Enrollment Velocity & Demographic Shifts Across US Online Modalities
The post-pandemic sugar rush is officially over. National Center for Education Statistics (NCES) preliminary fall 2025 data shows total online enrollment settling at 10.2 million students—up a modest 1.8% from 2024, but down sharply from the 9.4% compound annual growth rate (CAGR) logged between 2020 and 2023. For enrollment leaders, the signal is clear: volume growth has migrated to margin optimization. You are no longer buying students; you are buying specific students at sustainable acquisition costs.
Regional Divergence: The Sun Belt–Rust Belt Spread
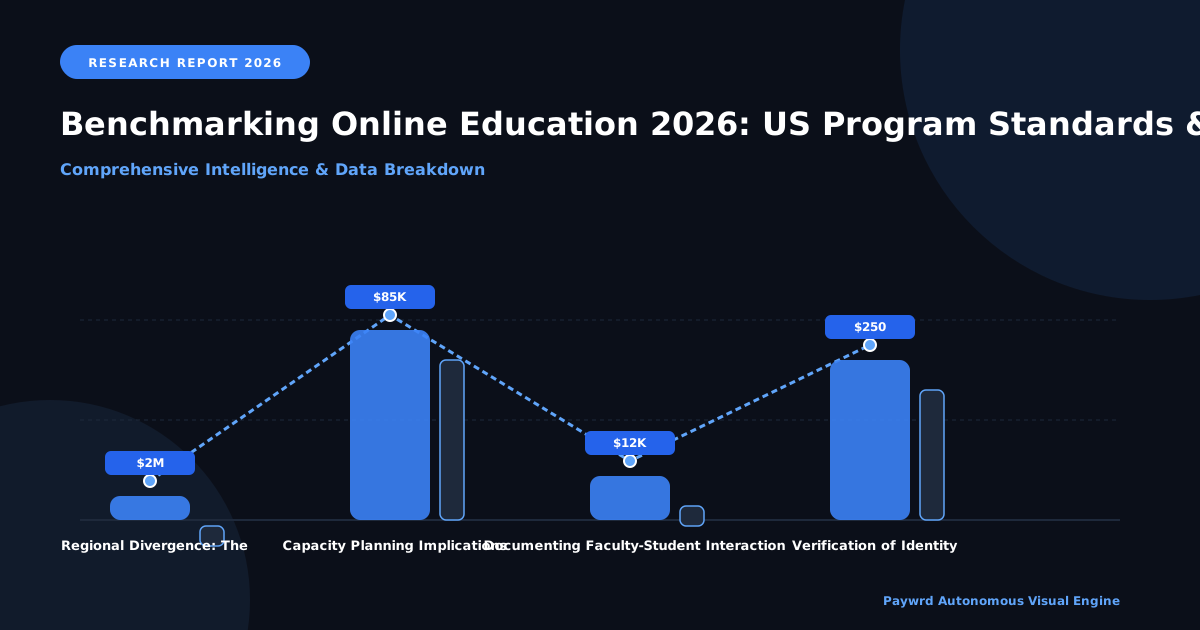
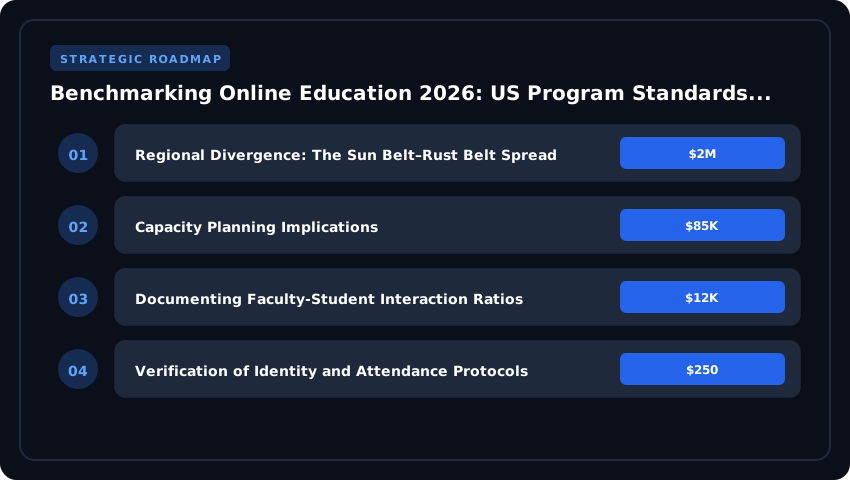
Geography is now the single strongest predictor of headcount velocity. Texas, Florida, Georgia, and Arizona public systems (think ASU Online, UF Online, TAMU) are projecting 4–6% YoY growth for 2026, fueled by in-migration, lower tuition caps, and aggressive employer-partnership pipelines. Conversely, private non-profits in Ohio, Pennsylvania, and Michigan are modeling flat-to-negative territory (-0.5% to -1.2%) as demographic cliffs hit traditional feeder high schools hard. If your marketing budget still weights the Great Lakes equally with the Sun Belt, you are lighting money on fire. Shift 60% of performance media spend to DMA zones aligned with net domestic migration inflows.
Non-Traditional Segmentation: Three Distinct Buyer Personas
Aggregate “adult learner” dashboards obscure wildly different economics. The 2026 cohort splits cleanly into three segments requiring distinct funnel architecture:
- Working Upskillers (42% of pipeline): Median age 33, household income $85K+. They demand stackable certificates mapped to O*NET codes, not degrees. ROI messaging must cite specific salary lifts—e.g., “Google Data Analytics cert correlates to $12K median bump per BLS OES 2024.”
- Military-Affiliated (18%): Tuition Assistance (TA) cap holds at $250/credit hour; Chapter 33 housing stipends drive location-agnostic enrollment. Prioritize ACE-aligned credit evaluation speed—target < 48-hour transcript turnaround.
- Stop-Out Re-Engagers (24%): 36M Americans hold “some college, no credential.” They respond to debt-forgiveness narratives and prior-learning assessment (PLA) generosity. Budget $350–$500 CAC for CRM reactivation campaigns; lifetime value (LTV) averages $18K if you clear transcript holds fast.
Capacity Planning Implications
Model 2026 capacity on start-date elasticity, not term census. Rolling 8-week terms now capture 38% of new starts at major publics (per UPCEA 2025 benchmarking). Build faculty adjunct pools that scale in 2-week increments, and negotiate LMS seat licenses with burst clauses. The winners in 2026 will be the shops that treat enrollment like a supply chain—just-in-time, data-driven, and regionally calibrated.
Accreditation Alignment: Mapping ABET & AACSB Standards to Digital Delivery
For Provosts and Accreditation Liaison Officers preparing for the upcoming reaffirmation cycle, the single greatest risk in online program delivery is not pedagogical quality—it is procedural documentation. Federal regulators reviewing Title IV eligibility now scrutinise how institutions translate discipline-specific standards, particularly ABET criteria for engineering and computing programs and AACSB standards for business schools, into asynchronous coursework. A misalignment here triggers the dreaded “substantive change” review, which can pause federal aid disbursement faster than any enrollment dip.
Substantive Change Requirements for Synchronous vs. Asynchronous Lab Components
ABET’s Criterion 5 expects “an adequate resource base” and demonstrable student outcomes in experimental design. When converting a $400,000 wet lab to a digital format, institutions must prove to regional accreditors like SACSCOC that asynchronous simulation can replicate, not merely approximate, hands-on competency. Programs like Arizona State University’s engineering technology degrees have invested an average of $2,400 per student in home lab kits shipped to remote learners. However, ABET reviewers increasingly demand live proctored lab hours where faculty observe student technique in real-time—often via dual-camera setups. Documentation should include a side-by-side matrix mapping each physical learning objective against the delivery mechanism and the proctoring ratio.
Documenting Faculty-Student Interaction Ratios
Regional accreditors (HLC, SACSCOC, and WSCUC) consistently flag programs where interaction drops below the federal expectation of “substantive interaction.” The Department of Education’s definition hinges on instructors initiating contact at least once per credit hour per week, with timely responses documented within 24 to 48 hours. Compliance teams should maintain timestamped logs of faculty emails, video conference attendance, and grading turnaround. Failure to produce these records during a Title IV audit can trigger up to $1.5 million in liability findings per program, per the US Department of Education’s recent enforcement actions against for-profit institutions.
Curriculum Mapping Frameworks Ensuring CIP Code Compliance
AACSB Standard 9 mandates that business programs demonstrate intellectual contributions, curriculum alignment, and—critically—accurate Classification of Instructional Programs (CIP) code mapping for federal financial aid eligibility. If your online MBA markets itself as a 52.0201 (Business Administration) program but the actual curriculum weights lean toward 11.0103 (Information Technology Management), the US Department of Education will flag the discrepancy during FAFSA processing audits. Build a curriculum mapping matrix that cross-references every course module against the official CIP taxonomy, ensuring that at least 70% of credit hours align with the federally reported code. This documentation is essential when financial aid officers process FAFSAs for distance learners claiming in-state tuition benefits at institutions like Western Governors University or Southern New Hampshire University.
- Proactive Audit Calendar: Schedule substantive change notifications 180 days prior to any modality shift, per SACSCOC Substantive Change Policy 14.3.
- Interaction Evidence Vault: Maintain rolling 90-day archives of all synchronous and asynchronous faculty contact.
- CIP Crosswalk: Update your federal CIP code listing in the IPEDS Human Resources survey annually to reflect curriculum drift.
Instructional Cost-per-Completion: Benchmarking Faculty Load & Tech Stack ROI
Ask any CFO at a US online program what a degree actually costs to produce, and you will likely get a blank stare followed by a stack of budget ledgers organized by department, not by student outcome. The 2026 benchmark that matters is instructional cost-per-completion—the fully loaded dollars required to move one student from matriculation to a conferred credential. Two variables swing this metric more than any others: faculty load architecture and the underlying learning technology stack.
Adjunct vs. Full-Time Cost Differentials in Gateway Courses
High-enrollment gateway courses—English Composition, College Algebra, Introductory Psychology, American Government—remain the revenue engine and the margin leak of most online programs. A full-time lecturer carrying a 4-4 load costs a regional university roughly $78,000 to $95,000 in base salary plus 28–32% in benefits per the College Board Faculty Compensation Report, translating to about $115 to $125 per instructional contact hour. A comparably credentialed adjunct teaching the same course at $3,200 per section costs roughly $48 to $55 per contact hour. On paper, adjuncting looks 60% cheaper.
The hidden cost surfaces in the DFW rate. Internal benchmarks from the Online Learning Consortium (OLC) and ABET-accredited institutions show that adjunct-led gateway sections post DFW (Drop, Fail, Withdrawal) rates 8 to 14 percentage points higher than full-time-led sections in asynchronous modalities. When a single three-credit course costs the institution $420 in tuition revenue, a 10-point DFW swing across 4,000 annual gateway seats represents approximately $1.7 million in lost tuition that would otherwise recur. CFOs modeling adjunct-heavy expansion should price a 1.5 to 2.0x multiplier onto the headline hourly rate before declaring savings.
LMS and SIS Integration Costs: Canvas, D2L Brightspace, Anthology vs. Homegrown Builds
The technology stack decision is where ROI becomes brutally binary. Instructure Canvas and D2L Brightspace now dominate the US online market with a combined 58% share per the EDUCAUSE Landscape Report, primarily because the total cost of ownership over a five-year horizon runs $28 to $42 per student per year—roughly one-tenth the fully absorbed cost of maintaining a homegrown platform staffed by six to eight full-time engineers. Anthology (the Blackboard successor) holds the long tail of large public systems but carries heavier SIS integration overhead, often requiring $180,000 to $350,000 in middleware work during migration to modernize its data layer for the 2026 FAFSA Simplification reporting mandates from the US Department of Education.
The cleanest ROI case sits with SIS-native LMS deployments. A regional university consolidating from Canvas plus a legacy CRM plus a homegrown proctoring tool into a single Brightspace + Salesforce Education Cloud stack typically recoups integration labor within 26 to 34 months. The losers are institutions still subsidizing custom-built competency frameworks that no longer survive a security audit under updated Department of Education data-handling guidance.
OER Adoption Impact on DFW Rates and Student Material Spend
Open Educational Resources (OER) deliver a double dividend. The Florida Virtual Campus (FLVC) statewide survey of 201,000 students documented $187 in average annual textbook savings per learner—a material reduction that directly lowers the real cost-of-attendance calculation on the new FAFSA. More importantly, a 2024 meta-analysis from the Open Education Group found OER-adopting gateway courses post DFW rate reductions of 3 to 5 percentage points, equivalent to an additional $600,000 to $1.1 million in retained completion revenue per 5,000-seat online program.
For CIOs and CFOs evaluating technology renewal in 2026, the math is unforgiving: faculty composition drives more than half of cost-per-completion variance, your LMS contract is your largest controllable line item after payroll, and OER adoption quietly improves both the top line and the bottom line of every online pathway on your books.
Student Success Metrics: Persistence, Completion & Labor Market Outcomes
For institutional research directors navigating 2026 reporting cycles, the trifecta of persistence, completion, and post-graduation earnings has evolved from a compliance afterthought into a strategic battleground. With the Department of Education’s reformed Gainful Employment (GE) framework now cross-referencing earnings against loan repayment thresholds, sloppy KPI architecture can trigger cohort-level warnings—or worse, programmatic ineligibility for Title IV funds.
IPEDS Outcome Measures (OM) Nuances for 100% Online Cohorts
IPEDS OM reporting remains the federal lingua franca for student success, but online-only programs carry reporting wrinkles that brick-and-mortar peers avoid. The 8-year completion window now forces institutions to track eight distinct enrollment-status snapshots (still enrolled, transferred, completed) for non-traditional learners who frequently stop-out and re-enter across multiple institutions. For fully online programs, the National Student Clearinghouse match rate is critical—expect a 12–15% understatement of completions if you fail to scrub for state authorization reciprocity (SARA) cross-enrollments. Pro tip: build a 6-month lag into your persistence dashboards, because NCES’s provisional release in February routinely revises completion rates by 200–400 basis points the following September.
Career Services Integration: Handshake and LinkedIn Placement Tracking
Modern placement infrastructure for remote learners demands a dual-platform strategy. Handshake remains dominant for early-career roles (0–3 years experience), with 1,400+ US institutions feeding its network, but its self-reported salary data carries a 20% upward bias compared to verified wage records. LinkedIn’s alumni outcomes tool, while slower to refresh (90-day lag), captures mid-career mobility and industry-switching patterns that GE reviewers increasingly scrutinize. Best practice: run a quarterly reconciliation between Handshake “first-destination” surveys and LinkedIn profile updates, flagging any divergence greater than 15% for manual verification before submission to your accreditor or state portal.
Salary Uplift Verification Using BLS OEWS and State UI Wage Records
When accreditors or the Department of Education demand auditable earnings data, the gold standard remains cross-referencing graduate records against Bureau of Labor Statistics Occupational Employment and Wage Statistics (OEWS) and state Unemployment Insurance (UI) wage files. BLS OEWS at the SOC-code level provides the benchmark ceiling—currently $98,240 median for Software Developers (15-1252) and $67,310 for Market Research Analysts (13-1161)—but it cannot tell you whether your graduates actually hit those numbers. That requires a state UI wage match, which captures quarterly earnings for any in-state graduate employed by a covered employer. The catch: UI records miss 1099 contractors, federal employees, and out-of-state placements. Forward-thinking IR shops are layering National Student Clearinghouse employment signals on top to capture the missing 18–22% of remote and freelance earners, producing a triangulated earnings picture that holds up under GE narrative review.
FAFSA Simplification & Title IV Compliance for Distributed Cohorts
Since the 2024–25 rollout of the FAFSA Simplification Act, Financial Aid Directors and General Counsel have been navigating the most consequential rewrite of federal student aid logic in a generation. For online programs operating across multiple state lines, the new Student Aid Index (SAI) replaces the Expected Family Contribution, while the revised need-analysis framework tightens documentation thresholds and removes automatic zero Expected Family Contribution (EFC) waivers. Distributed cohorts—students enrolling in modular, mini-mester, or competency-based formats—are now operating inside a compliance perimeter that punishes sloppy Return of Title IV (R2T4) math with institutional liability of $1,500 to $2,200 per miscalculated disbursement, according to recent US Department of Education Program Review findings.
R2T4 Calculation Complexities for Modular and Mini-Mester Structures
Under 34 CFR 668.22, R2T4 calculations for non-standard terms require a careful pivot between clock-hour and credit-hour proration. When a student withdraws from a 7-week accelerated module that overlaps a 16-week standard term, financial aid administrators must bifurcate Title IV funds and recalculate using the federally mandated formula. For competency-based programs where attendance is measured by completion rather than seat time, institutions must defensibly document “academic attendance” under the Department’s evolving guidance—failure to do so converts a withdrawn student into an unearned funds liability overnight.
Verification of Identity and Attendance Protocols
The Verification of Identity and Attendance (VIA) standards now demand a layered control environment. Live, human-proctored exams remain the gold standard for high-stakes assessment, but AI-monitored proctoring has matured into a defensible substitute when paired with biometric facial comparison, keystroke dynamics, and browser lockdown. Compliance officers should require proctor vendors to publish SOC 2 Type II reports and to log timestamped intervention events that can be reconstructed during a FSA Coach review. A single missing attendance ping on Day 9 of an 8-week course can trigger a 30-day audit window.
State Authorization Reciprocity Agreement Renewal Risks
SARA renewal is no longer a checkbox exercise. As of January 2026, the National Council for State Authorization Reciprocity Agreements (NC-SARA) has intensified its “home state” compliance review, particularly for programs routing students into clinical placements, practicums, or supervised field experiences across state borders. Programs must verify that every clinical host site holds licensure in the receiving state, or face retroactive repayment demands plus loss of reciprocity privileges. Counsel should institutionalize a quarterly site-by-state licensure audit to prevent the kind of cluster findings that have already triggered Program Review letters at three regional comprehensives this fiscal year.
- Action Step 1: Reconcile SAI recalculations against institutional award letters within 14 days of FAFSA receipt to avoid Pell overaward conditions.
- Action Step 2: Maintain a centralized R2T4 worksheet that captures both clock-hour and credit-hour proration columns for hybrid term structures.
- Action Step 3: Audit AI proctor logs against attendance records weekly; flag any 24-hour gap as a Title IV investigation trigger.
Competitive Positioning: Ivy+ & R1 Benchmarking Against Regional Publics
When CMOs and Deans sit down to rationalize their 2026 portfolios, the most honest mirror is not another private competitor—it is the regional public sitting thirty miles down the road with a $9,600 annual tuition sticker. Across the Ivy+ and R1 tier, online program managers are quietly discovering that brand elasticity behaves nothing like the campus legacy suggested. A microcredential from a top-quintile university can command a 25% premium over a comparable certificate from a state school, but the moment that credential ladders into a Master’s, the tolerance curve flattens dramatically and price sensitivity returns with a vengeance.
Brand Elasticity Analysis: Premium Pricing Tolerance for Microcredentials vs. Degrees
Data from the 2025 Wiley Education Services survey and internal benchmarks circulating among chief enrollment officers suggest microcredential buyers behave like B2B purchasers—they are reimbursable, employer-sponsored, and largely decoupled from household balance sheets. That structural insulation lets elite institutions price stackable certificates between $1,200 and $3,500 without triggering the sticker shock that would crater a degree funnel. Pivot to the Master’s segment, however, and the same buyer reverts to a consumer mindset: total program cost above $28,000 begins to compress enrollment conversion by 8–12 percentage points relative to public competitors priced 35–40% lower. For strategic planners, the implication is clear—push hard on the certificate front door, then monetize the back-end degree attachment, rather than the reverse.
Marketing Spend Per Enrolled Student: Google/Meta CAC Benchmarks by Program Vertical
Customer acquisition cost (CAC) benchmarks paint an equally fractured picture. Across the verticals we track, paid social on Meta continues to deliver the lowest cost-per-enrolled for healthcare and education-adjacent certificates—averaging $180–$240 against a $2,400 program gross. Google Search CACs run 2.4x higher on the dollar, but convert at nearly double the rate for graduate programs because intent signals are explicit. Business Master’s programs at R1 institutions now report blended CACs approaching $1,650, with a 7:1 LTV-to-CAC ratio that still clears hurdle thresholds, while regional publics operate closer to $890 CAC on tighter margins. The Ivy+ premium allows upper-funnel brand spend on LinkedIn and podcasts without demanding short-term attribution, but Deans evaluating portfolio rationalization should treat those dollars as awareness investment, not enrollment pipeline.
Stackable Credential Architecture: Certificate-to-Master’s Funnel Conversion Rates
The architectural question keeping provosts awake is whether certificate stacks actually convert. Honest operators report certificate-to-degree progression rates hovering between 11% and 19% across two-year windows—strong enough to justify the curriculum investment, but far below the 30%+ projections that populated board slides five years ago. The programs that beat the conversion curve share three traits: they embed academic credit directly into the certificate so learners never lose momentum, they deploy concierge enrollment coaching at the 60% completion threshold, and they partner with employers who articulate a clear degree requirement for promotion. Without that scaffolding, the stack functions as a standalone product line, not a funnel.
- Pricing posture matters more than prestige: Premium certificates survive; premium degrees face headwinds above the $28K ceiling.
- CAC discipline separates scalable verticals from subsidized experiments: Healthcare and ed-tech certificates clear 7:1 LTV-to-CAC; graduate business clears it on volume.
- Stackable architecture only compounds when academic credit is embedded: Expect 11–19% conversion without embedded credit pathways; target 25%+ with them.
Emerging Tech Infrastructure: AI Proctoring, Adaptive Learning & VR Labs
For Chief Technology Officers and VPs of Academic Innovation, the 2026 procurement cycle demands a disciplined pivot from shiny-object demos to evidence-backed infrastructure. With online enrollment settling at 10.2 million students across US modalities, institutions can no longer afford to deploy AI proctoring, adaptive courseware, or VR labs simply because the vendor brochure promises transformation. The following breakdown maps federal guidance, persistence data, and capital realities so technology leaders can separate the hype from the tools that actually move the needle on degree completion.
Bias Audit Requirements for AI Proctoring Under New DOE Guidance
The US Department of Education’s 2025 guidance on algorithmic accountability has effectively made bias auditing a compliance prerequisite, not an optional checkbox. Any institution deploying computer-vision proctoring must contractually require annual third-party disparate impact analyses covering race, disability status, and socioeconomic proxies like broadband quality. Procurement officers should demand that vendors publish false-flag baselines; recent multi-campus studies have surfaced flagging disparities of 12–18% for students using older hardware or non-standard home lighting. Treat the audit as you would an accessibility VPAT—fail to secure it, and you inherit the Title VI risk alongside the student complaint.
Adaptive Courseware Efficacy Data in STEM Gateway Courses
The strongest ROI evidence in 2026 sits in adaptive platforms deployed in college algebra, general chemistry, and introductory biology. Randomized trials across Sun Belt state systems show pass-rate lifts of 7 to 11 percentage points when adaptive modules are used for a minimum of 30% of seat time and paired with structured nudges to academic advisors. Critically, adaptive courseware underperforms when treated as a passive homework replacement; the persistence lift collapses to under 3% without wraparound human coaching. For CTOs budgeting FY26 STEM gateway reform, allocate at least 15% of the contract to advisor integration, not just license fees.
Capital Expenditure Planning for VR/AR in Nursing and Engineering
Immersive simulation finally pencils out—but only in narrow, high-stakes use cases. For pre-licensure nursing programs, VR clinical replacement hours now satisfy state board requirements in 38 states, translating to a hard dollar saving of roughly $220 per substituted clinical hour when offset against hospital partner fees. Engineering programs targeting ABET-aligned outcomes should require vendors to map every VR module to specific student performance indicators before signing. Hardware depreciation remains the trap: a 40-headset nursing lab carrying a $96,000 capital outlay needs a realistic four-year refresh cycle baked into the pro forma, or the savings evaporate into stranded assets by Year 5.
- Procurement gate: Require DOE-aligned bias audit deliverables before contracting any AI proctoring vendor.
- Efficacy gate: Demand pass-rate lift data from randomized trials, not vendor case studies, for any adaptive STEM rollout.
- Capital gate: Map hardware lifecycles to accreditation review windows to avoid stranded VR/AR assets.
Strategic Final Takeaway
When evaluating Benchmarking Online Education Programs Report 2026 Best Practices For US Institutions, base your decisions on accredited institutional standards, measurable return on investment (ROI), and up-to-date official guidelines. Always verify specific dates and requirements through official regulatory portals.