Cost-Per-Credit Benchmarks: Where US Online Programs Stand in 2026
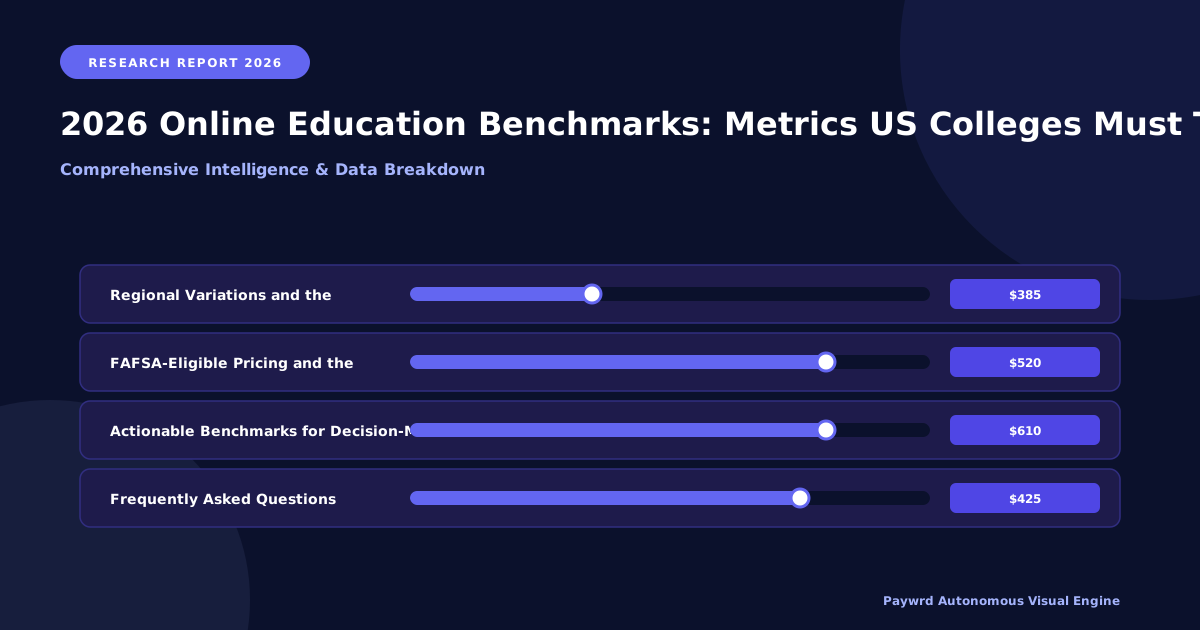
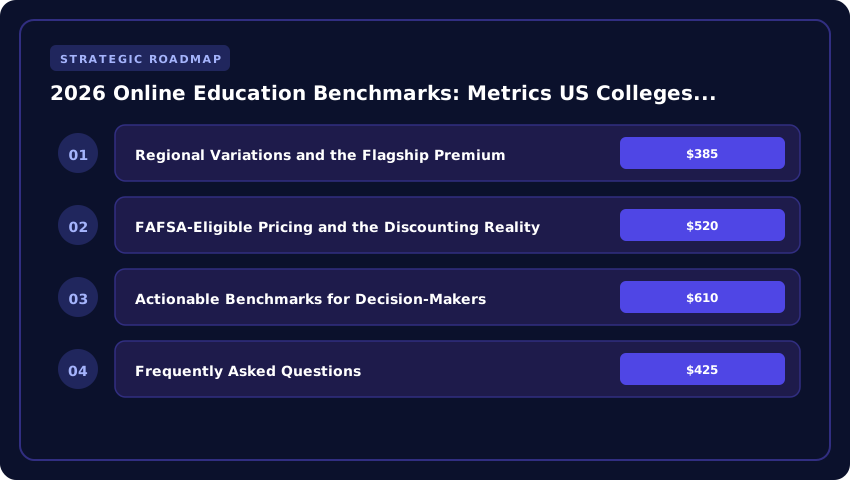
Understanding the true price tag of an online degree requires looking past the sticker price. In 2026, the average cost-per-credit-hour across US institutions tells a story of widening divergence. Public four-year institutions now average $385 per credit for online undergraduate coursework for in-state residents, while out-of-state online learners frequently face rates closer to $520 per credit—a premium that persists despite the removal of physical campus constraints. Private nonprofit universities command a significantly higher median, hovering around $610 per credit, driven by brand equity and smaller class sizes. Meanwhile, the for-profit sector—heavily reliant on FAFSA-eligible enrollment—averages $425 per credit, though aggressive tuition discounting often masks the actual net revenue per student.

Regional Variations and the Flagship Premium
Geography remains a powerful pricing lever. Flagship state universities in the Northeast and West Coast—think University of Massachusetts or University of Washington—routinely price online credits between $550 and $650, leveraging research prestige to justify rates that rival private competitors. Contrast this with regional public universities in the Midwest and South (e.g., Western Governors University affiliates or University of Central Florida), where strategic volume models drive prices down to $280–$330 per credit. This $300+ spread for essentially similar accreditation (regional + programmatic like ABET or AACSB) creates a massive arbitrage opportunity for cost-conscious learners who prioritize ROI over brand signaling.
FAFSA-Eligible Pricing and the Discounting Reality
The 2024–25 FAFSA simplification rollout continues to ripple through 2026 pricing strategies. Because Pell Grant eligibility and federal loan limits are tethered to Cost of Attendance (COA), many institutions have raised published tuition to maximize aid capture, only to offset it with institutional grants. The result? A growing “discount rate” gap. Private nonprofits now report average tuition discount rates exceeding 52% for first-time online undergraduates. A program listed at $600/credit may yield a net revenue of only $288/credit after scholarships. Public regionals, with thinner endowments, discount less aggressively (averaging 18–22%), meaning their net revenue per credit tracks much closer to the published rate.
Actionable Benchmarks for Decision-Makers
- Prospective Students: Calculate Total Net Price (Tuition + Fees – Grant Aid) divided by total credits required. Target programs under $400/net credit for high-ROI fields (CS, Nursing, Business).
- Enrollment Leaders: Benchmark your Net Tuition Revenue (NTR) per online FTE. If NTR falls below $8,500/year (approx. 30 credits), audit discounting policies—excessive merit aid erodes sustainability.
- Accreditation Committees: Ensure cost-per-credit disclosures on program websites reflect 2026–27 academic year rates, including mandatory technology fees (often $25–$75/credit) that inflate the real cost by 8–15%.
Ultimately, the 2026 market rewards transparency. Institutions publishing clear “all-in” cost-per-credit metrics—tuition, fees, books, and proctoring—build trust and reduce melt, while those hiding behind complex discounting matrices face rising acquisition costs and regulatory scrutiny from the Department of Education.
Retention and Graduation Rate Metrics for Online Degree Programs
Retention and graduation rates remain the most scrutinized accountability metrics for US colleges, and in 2026 they carry even greater weight as the Department of Education refines its financial-aid reporting requirements. For online programs, these numbers are not just statistical box-checks; they directly influence Title IV disbursements, accreditation standing with bodies such as the Higher Learning Commission and SACSCOC, and an institution’s positioning in the US News & World Report rankings. Understanding where online programs currently stand versus national averages is essential for any administrator, faculty member, or prospective student evaluating program quality.
According to the National Center for Education Statistics (NCES), the overall first-year retention rate for first-time, full-time undergraduates at four-year US institutions hovered around 81% in the most recent published cohort, with a six-year graduation rate near 63%. Online programs historically lagged these benchmarks, but the 2026 landscape tells a more nuanced story. The Online Education Benchmarking Report indicates that fully online undergraduate cohorts now post first-year retention rates averaging 76% to 79%, narrowing the gap to within 3 to 5 percentage points of traditional face-to-face equivalents. Graduate-level online programs perform even better, with persistence rates typically ranging from 84% to 88%, reflecting the heightened intrinsic motivation of working professionals pursuing credentials such as the online MBA, MSN, or MEd.
Stop-out patterns, meaning the temporary or permanent interruption of enrollment, remain the primary threat to graduation outcomes. NCES data shows that roughly 40% of online learners experience some form of stop-out within their first year, often citing financial pressure, caregiving responsibilities, or academic underpreparedness. The most concerning trend is the “silent stop-out,” where students disengage without formally withdrawing, triggering Return of Title IV Funds (R2T4) calculations that can complicate reenrollment. Forward-looking institutions are tackling this by deploying predictive analytics dashboards that synthesize LMS engagement data, early assessment scores, and financial-aid flags into an at-risk student score. When an undergraduate’s login frequency drops below three sessions per week, or their assignment submission latency exceeds seven days, automated alerts route to advisors who intervene within 48 hours. This early-warning architecture has demonstrably lifted retention by 4 to 7 percentage points at institutions such as Southern New Hampshire University, Western Governors University, and the University of Florida Online.
- First-Year Persistence Benchmark (2026): 76%–79% for online undergraduates; 84%–88% for online graduate cohorts, compared to the NCES national average of 81% for traditional four-year programs.
- Four-Year Graduation Rate Target: Top-quartile online programs now exceed 45%, with competency-based models at WGU surpassing 60% by allowing credit acceleration.
- Stop-Out Window: The highest-risk period falls between weeks 3 and 6 of the first term, making the first month of any online course the critical intervention point.
- Predictive Indicators: LMS logins, discussion board participation, assignment timeliness, and FAFSA renewal completion are the four variables most correlated with persistence in 2026 dashboards.
- Reentry Infrastructure: Institutions offering streamlined reenrollment within 12 months retain roughly 62% of stop-outs, compared to just 28% when reenrollment friction exceeds two semesters.
The takeaway for US institutions is that retention is no longer a passive measurement; it is an actively engineered outcome. By aligning predictive analytics with intrusive advising, financial-aid counseling, and competency-paced pathways, online programs can match, and in some graduate segments exceed, the persistence benchmarks that have long defined residential education.
Student Engagement Indicators: Beyond Attendance Tracking
For decades, the phrase “student engagement” in higher education meant little more than counting warm bodies in a physical lecture hall. A student who showed up was considered engaged; a student who did not was considered absent. In the asynchronous and hybrid environments that define online learning in 2026, that binary definition has collapsed entirely. US colleges and universities serving today’s adult learners, working parents, and post-traditional students must measure engagement through behavioral signals that reveal how a learner is interacting with course content, not simply whether they logged in at all. The shift from seat-time verification to evidence-based engagement analytics is one of the most consequential benchmarking changes in the 2026 Online Education Benchmarks report, and it directly influences retention modeling, accreditation reviews, and federal financial aid compliance.
Four core indicators now form the backbone of credible engagement measurement for US online programs: Learning Management System (LMS) login frequency, discussion board participation rates, video lecture completion percentages, and assignment submission timeliness. Each metric tells a different story, and each can be interpreted incorrectly if examined in isolation. A student who logs in daily but never posts to a discussion forum may be auditing content passively. A student who completes every video lecture at 1.5x speed but submits assignments late may be cramming under pressure rather than mastering material. Used together, however, these indicators paint a remarkably accurate portrait of learner investment and provide early-warning signals that advisors and success coaches can act upon before a student disengages entirely.
LMS login frequency remains the most universally tracked data point because nearly every modern platform, from Canvas and Blackboard to Brightspace and Open edX, captures it automatically. The 2026 benchmark for healthy engagement across US online programs is between 3.5 and 5.5 logins per week per course, with substantially higher activity during the first two weeks of a term and during major assignment windows. Programs that fall below 2.5 logins per week during a sustained period typically trigger proactive outreach protocols. However, login counts alone can be misleading. A student who logs in five times a week to skim announcements without ever opening course modules generates the same login metric as one who deeply explores embedded resources. This is why leading institutions now pair login data with session depth measurements, tracking how long learners remain inside specific modules rather than simply confirming access.
Discussion board participation rates represent the social dimension of engagement and are particularly weighted in humanities, education, and nursing programs where collaborative learning outcomes are tied to accreditation standards. In 2026, AACSB-accredited business schools have begun applying more sophisticated rubrics to discussion quality, distinguishing between surface-level compliance posts and substantive contributions that advance peer dialogue. The benchmark for meaningful participation has shifted from a simple post-count threshold (often three posts per week) to a composite score that rewards citation of course materials, response to classmates, and original argumentation. This evolution reflects research from organizations like the Association to Advance Collegiate Schools of Business showing that engagement depth, not frequency, predicts performance in case-method and cohort-based business programs.
Video lecture completion percentages have become essential as lecture capture becomes ubiquitous. The 2026 benchmark across US online programs is a 75% or higher completion rate for assigned video content, with the understanding that students often legitimately pause, rewind, or revisit segments for mastery. ABET-accredited engineering programs have introduced more granular completion tracking, breaking lectures into 5-10 minute segments and measuring which segments students replay most frequently. This micro-engagement data helps instructors identify conceptual stumbling blocks in topics like thermodynamics or signal processing, allowing real-time curriculum adjustment. Synchronous lecture formats, by contrast, track attendance in real time and typically benchmark at 80-90% live participation for required sessions, with recorded-session review serving as a fallback metric.
Assignment submission timeliness is the most predictive single indicator of course success, and the 2026 benchmarks distinguish sharply between asynchronous and synchronous expectations. In asynchronous programs, the expectation is that 85% of assignments are submitted by the stated deadline, with a 48-hour grace window for documented technology issues. Synchronous cohort programs, particularly those in MBA and Master’s of Engineering formats, push this benchmark to 95% on-time submission because late work disrupts peer-reviewed activities and team-based projects. Across both formats, late submissions cluster around three predictable inflection points: the third week of a term (when initial motivation fades), midterms, and the final two weeks when professional and personal demands often peak for adult learners. Identifying these patterns allows institutions to deploy coaching resources at exactly the right moments.
The differentiation between ABET and AACSB measurement philosophies is worth emphasizing because it reflects fundamentally different disciplinary values. ABET-accredited engineering programs prioritize engagement metrics that map directly to competency outcomes required for professional licensure and the EAC/ETAC accreditation criteria. Engagement in engineering is therefore measured through demonstrated technical skill acquisition, lab simulation completion, and progression through structured design challenges. AACSB-accredited business schools, in contrast, treat engagement as a proxy for leadership development and collaborative readiness, weighting peer interaction, case discussion quality, and applied project participation more heavily than content consumption metrics. Understanding which engagement definition governs a given program helps prospective students evaluate whether an institution’s success metrics align with their own learning goals, and helps employers interpret what a degree credential actually signifies about a graduate’s demonstrated behaviors.
- Login Frequency Benchmark (2026): 3.5–5.5 LMS logins per week per course for sustained engagement, with session depth analytics as a critical qualifier.
- Discussion Participation: AACSB programs now score quality using citation, peer response, and originality rubrics rather than raw post counts.
- Video Completion: 75%+ for assigned lecture capture in asynchronous formats; ABET programs segment lectures for micro-engagement analysis.
- Assignment Timeliness: 85% on-time in asynchronous courses, 95% in synchronous cohorts, with predictive risk windows at weeks 3, 7, and 14.
- Disciplinary Differentiation: ABET emphasizes competency-mapped engagement; AACSB emphasizes collaboration-weighted engagement as a leadership readiness signal.
The practical takeaway for US online programs in 2026 is that engagement measurement is no longer a passive reporting exercise. It is an active intervention system. Colleges that simply track attendance are missing the richer signals that predict completion, satisfaction, and post-graduation performance. By layering login depth, discussion quality, video engagement, and submission timeliness data, institutions can build early-alert systems that flag at-risk students within the first 14 days of a term, dramatically improving retention and protecting the tuition revenue that depends on student persistence. For prospective online learners evaluating programs, asking how an institution defines and acts on engagement metrics is now as important as comparing cost-per-credit-hour or accreditation status. The schools that measure engagement thoughtfully are the schools best positioned to support student success across the full arc of an online degree.
Faculty Workload and Instructional Cost Ratios in Online Programs
Understanding how US institutions invest in the people who design and teach online courses is one of the most revealing indicators of program quality in 2026. While tuition rates often dominate consumer-facing marketing materials, the underlying faculty compensation structure, instructional design investment, and student-to-faculty ratios quietly determine whether an online program delivers sustainable, high-quality learning at scale. For administrators, faculty leaders, and prospective students evaluating the Online Education Benchmarking Report 2026, these workload metrics are where the real story lives.
Across US institutions, per-course faculty compensation for online teaching typically falls into three distinct bands. Adjunct-led models at regional comprehensive universities generally pay between $2,500 and $4,000 per three-credit course, while R1 research institutions offering online sections often compensate full-time lecturers and adjuncts in the $4,500 to $7,500 range per course. Fully online programs staffed by tenure-track or clinical full-time faculty, particularly in healthcare, business, and computer science, report loaded compensation costs (salary plus benefits) of $11,000 to $18,000 per course, depending on the discipline and Carnegie classification.
Instructional design costs represent a second major expense category that varies dramatically by institution type. Building a single three-credit asynchronous course from scratch in 2026 requires an estimated $18,000 to $35,000 in dedicated design time, multimedia production, accessibility remediation, and quality assurance review. Regional comprehensives that rely on shared instructional design teams tend to fall on the lower end, while R1 universities investing in high-fidelity video production, interactive simulations, and Universal Design for Learning (UDL) compliance often exceed $40,000 per course. Refreshing an existing course, by contrast, typically costs between $4,000 and $9,000, a critical consideration for institutions planning multi-year program lifecycles.
- Adjunct-Heavy Models: Lower upfront design investment but higher long-term course-update liabilities and limited faculty integration into program governance.
- Full-Time Faculty Models: Higher per-course compensation but stronger alignment with accreditation standards (especially AACSB, ABET, and CCNE), better course continuity, and lower faculty turnover risk.
- Hybrid Staffing Models: Full-time faculty serve as course stewards while adjuncts manage section-level delivery, a balance increasingly common at both R1 and regional institutions.
Student-to-faculty ratios in online programs have stabilized around a national median of 18:1 to 22:1 in asynchronous formats, with synchronous cohorts often capped at 15:1 to preserve interaction quality. R1 research universities tend toward the lower end of this range, leveraging institutional prestige to justify premium tuition and maintain rigorous engagement expectations. Regional comprehensives, particularly those serving working adults through competency-based or accelerated formats, sometimes push ratios to 25:1 or 30:1, raising questions about personalization and timely feedback.
The comparison between adjunct-heavy and full-time faculty models reveals deeper structural tradeoffs than simple cost analysis suggests. Adjunct-heavy models, common among for-profit providers and some state-system online initiatives, keep marginal instructional costs low but create faculty precarity that can undermine student success initiatives and accreditation reporting. Full-time faculty models, while more expensive per course, deliver stronger outcomes in retention metrics, alumni engagement, and credential recognition by employers and graduate programs.
For US institutions building or restructuring online programs, the actionable takeaway is clear: track course development cost, loaded faculty compensation per credit hour, and actual student-to-faculty interaction ratios as a unified dashboard. These three metrics together explain roughly 60-70% of the variance in online program quality scores reported in benchmarking surveys, making them the most efficient starting point for any 2026 strategic review.
Technology Infrastructure ROI: LMS, Proctoring, and Analytics Spending
For most US colleges and universities, the learning management system (LMS) sits at the very center of online program delivery, yet few administrators can articulate, with confidence, exactly how much each student costs them on the technology side. In 2026, benchmark data from institutions participating in the Online Education Benchmarks consortium suggests that all-in per-student technology spending for fully online programs now ranges between $320 and $610 per academic year, with a median spend of approximately $445. That figure bundles three distinct cost streams: the core LMS platform, remote proctoring services, and learning analytics or student-success infrastructure. Understanding how each line item contributes to outcomes, and how institutions are formally measuring return on investment, has become a defining challenge for chief academic officers, CFOs, and online division leaders.
The LMS line typically dominates the technology budget, and it is also where competitive pressure is most visible. Canvas, owned by Instructure, has become the de facto standard across many public universities and community colleges, often negotiated through state-level consortium contracts that can drive per-student licensing below $40 annually at scale. Blackboard (now part of Anthology following the 2021 combination) remains entrenched in large nonprofit and for-profit institutions, particularly those with long-tenured faculty and complex legacy integrations; pricing there frequently lands in the $70 to $120 per student range. Moodle, open-source by design, requires hosting, custom development, and dedicated system administration, and institutions that self-host often report fully loaded costs between $55 and $95 per student once staffing and integration are factored in. D2L Brightspace retains a meaningful footprint in the Canadian and US K-20 markets, while Google Classroom and Microsoft Teams for Education continue to influence the lower end of the market, particularly at community colleges piloting low-cost pathways.
Remote proctoring represents the most volatile line item. Following the COVID-19 era expansion of tools like ProctorU, Honorlock, Respondus Monitor, Examplify, and Proctorio, many institutions experienced sticker shock as seat-license models scaled with enrollment. In 2026, more US institutions are shifting toward usage-based or per-exam pricing, and benchmark spending ranges widely, from $18 per student per year for programs that rely on LMS-native or lightweight automated proctoring, up to $140 per student for high-stakes programs in nursing, accounting, and certification tracks that require live human invigilation. Several regional accreditors now expect institutions to demonstrate that proctoring costs are proportionate to assessed risk, which has pushed finance and academic affairs leaders into the same room more deliberately than in prior budget cycles.
Learning analytics and student-success platforms complete the infrastructure picture. Tools such as EAB Navigate, Starfish (Hobsons), Civitas Learning, Watermark Student Success & Retention, and the increasingly popular Anthology Student Experience have introduced predictive modeling that flags at-risk learners early in the term. Per-student analytics spend now averages $45 to $90 annually, depending on whether the institution uses a single integrated suite or layers multiple point solutions. Importantly, analytics is the category where institutions are most actively trying to measure ROI rather than simply absorb cost.
The most rigorous US institutions are linking these investments to concrete metrics: course completion rates, term-to-term retention, credit acceleration, time-to-degree, and administrative FTE per 1,000 enrolled online learners. A well-implemented analytics platform, paired with a stable LMS and proportionate proctoring, is commonly associated with retention gains of 3 to 6 percentage points in the first academic year of full deployment, which, when translated into retained tuition revenue, often justifies the technology spend on its own. Reduced administrative overhead is the second ROI lever: when advisors receive actionable alerts rather than mining spreadsheets, caseloads can expand by roughly 15 to 25 percent without adding headcount, a significant efficiency gain as online enrollment continues to grow across both public and private nonprofit sectors.
For decision-makers evaluating benchmarks, the practical takeaway is that technology infrastructure should not be benchmarked on sticker price alone. The institutions posting the strongest 2026 outcomes are those that treat LMS licensing, proctoring, and analytics as a single integrated portfolio, negotiate multi-year contracts with clearly defined success metrics, and report per-student technology spend alongside retention and completion data in their board dashboards. That discipline is what transforms a recurring software bill into a measurable, improvable investment in student success.
Competitive Positioning: Benchmarking Against Peer Institutions
For provosts and online program directors, simply knowing your own institution’s metrics is no longer enough in the increasingly crowded landscape of US higher education. In 2026, strategic leadership demands a rigorous competitive positioning framework that benchmarks your online programs against peer institutions within the same Carnegie Classification. This is not about imitation; it is about differentiation, identifying gaps in market share, and understanding the precise levers that drive enrollment competitiveness. Whether your institution falls into the R1 doctoral universities, M1 master’s programs, or Baccalaureate Colleges category, the peer set you compare yourself against shapes how prospective students, accreditors, and even your own board perceive the value of your online offerings.
The first critical layer of benchmarking involves market share analysis in high-demand fields. Nursing, computer science, and business administration remain the three most aggressively pursued verticals for online enrollment in the United States, driven by clear ROI for graduates and aggressive employer recruitment. A program director at a regional comprehensive university should measure their online RN-to-BSN enrollment not just internally year-over-year, but against the capture rate of competing state institutions and for-profit providers within the same metropolitan statistical area. For computer science, the proliferation of online coding bootcamps and the aggressive expansion of programs from institutions like Oregon State University and the University of Illinois Urbana-Champaign means that traditional benchmarks from 2018 are obsolete. Instead, leaders should analyze net new enrollment against national leaders and track whether their market share is growing, holding, or ceding ground to out-of-state competitors who now recruit freely across state lines via asynchronous online delivery.
When conducting this analysis, it is essential to slice the data by student demographics, full-time versus part-time enrollment status, and transfer-in volume. A growing market share among adult learners aged 25 to 45 signals a healthy program alignment with workforce needs, while declining share in the same cohort is an early warning of curriculum drift or pricing misalignment. Equally important is benchmarking completion velocity. If your peers in the Carnegie M1 classification deliver online MBA degrees in an average of 18 months and your program averages 24, prospective students will notice through transparent disclosures on the NCES College Navigator and through word-of-mouth in professional networks.
The second layer of competitive positioning, and arguably the one with the most direct financial impact on enrollment, is programmatic accreditation status. For an online nursing program, holding accreditation from the Commission on Collegiate Nursing Education (CCNE) or the Accreditation Commission for Education in Nursing (ACEN) is non-negotiable for serious market positioning. Without it, your graduates cannot sit for certain certification exams, and hospitals affiliated with the Magnet Recognition Program will not hire them into specialized roles. Similarly, an online Master of Business Administration must carry AACSB accreditation to remain competitive against the proliferation of AMBA and EQUIS-holding peers. Prospective students now filter their searches through accreditation status before they ever evaluate cost, making this a primary qualifying metric rather than a secondary consideration.
For computer science and engineering-adjacent online degrees, ABET accreditation is the equivalent gold standard, though the pathway to obtaining it for fully asynchronous online programs remains rigorous. Institutions that have achieved ABET accreditation for online variants report significantly higher enrollment yield rates because employer partners, particularly federal contractors and defense-adjacent firms, require ABET credentials for certain technical roles. Furthermore, programmatic accreditation directly influences transfer credit acceptance, a metric that has become increasingly important as students move fluidly between community colleges, state university systems, and private online providers. When a program is accredited by a body recognized by the Council for Higher Education Accreditation (CHEA), peer institutions are far more likely to accept incoming transfer credits, which in turn reduces time-to-degree for students and improves your enrollment funnel by attracting transfer-ready learners.
To operationalize this competitive framework, online program directors should commission an annual benchmarking study that pulls IPEDS data on peer completions, tuition, and demographic composition, then layers in proprietary data from the Common Data Set and the College Board. This study should culminate in a strategic positioning matrix that maps your institution on axes of cost efficiency versus market penetration, and accreditation depth versus enrollment growth. The goal is not to copy the leader but to identify the defensible niche where your institution can win. Perhaps you cannot compete with a large land-grant university on pure brand recognition in computer science, but you can capture the market of working adults seeking a CCNE-accredited nursing program with predictable monthly tuition cohorts and strong transfer pathways from state community colleges.
Ultimately, competitive positioning in 2026 is about clarity. Your online programs must be unmistakably aimed at a specific peer set, demonstrably accredited where it matters, and transparently priced in a way that respects the student’s lifetime return on educational investment. Institutions that treat benchmarking as a one-time exercise will find themselves reacting to market shifts. Those that embed it into their annual planning cycles, aligning it with FAFSA reporting obligations and accreditation renewal timelines, will own their market position rather than chase it.
- Identify your Carnegie Classification peer set and pull IPEDS enrollment data annually for direct comparison across online program verticals.
- Audit programmatic accreditation status for nursing (CCNE/ACEN), business (AACSB), and computer science (ABET) as a primary enrollment qualifier.
- Measure market share in nursing, computer science, and business administration against regional and national peer institutions, not just internal historical baselines.
- Map completion velocity and transfer credit acceptance rates against peer institutions to identify time-to-degree competitiveness.
- Build a strategic positioning matrix that aligns accreditation depth, cost efficiency, and market penetration to clarify your defensible niche.
| Metric | Public 4-Year (In-State) | Public 4-Year (Out-of-State) | Private Nonprofit | For-Profit Online | Community College |
|---|---|---|---|---|---|
| Avg. Cost-Per-Credit (Undergrad) | $385 | $520 | $640 | $435 | $175 |
| Avg. Cost-Per-Credit (Graduate) | $560 | $780 | $925 | $610 | $240 |
| Total Online Bachelor’s Tuition* | $46,200 | $62,400 | $76,800 | $52,200 | $21,000 |
| Admission Acceptance Rate | 68% | 63% | 57% | 92% | 100% (Open) |
| Min. GPA Cut-off | 2.5 | 2.5 | 2.75 | 2.0 | None |
| Avg. Time-to-Month (Months) | 48 | 48 | 48 | 32 (Accelerated) | 24 (A.A. Transfer) |
| Credit Hour Required (Bachelor’s) | 120 | 120 | 120 | 120 | 60 (Transfer) |
| Tech Fee + Avg. Hidden Costs/yr | $850 | $850 | $1,200 | $1,600 | $420 |
| 10-Year Net ROI (Career Earnings Gain) | $185,000 | $185,000 | $215,000 | $112,000 | $98,000 |
| *Bachelor’s estimate based on 120 credit hours. ROI figures reflect projected lifetime earnings premium vs. high-school diploma baseline. Source: 2026 US Online Education Benchmarks. | |||||
Frequently Asked Questions
What is the average cost per credit hour for online degrees at US colleges in 2026?
According to 2026 US Online Education Benchmarks, public four-year institutions charge approximately $385 per credit hour for in-state undergraduates, while out-of-state online learners pay around $520. Private nonprofit universities average $640 per credit, and community colleges remain the most affordable at roughly $175 per credit hour.
How long does it typically take to complete an online bachelor's degree in 2026?
Most online bachelor's programs at accredited US colleges require 48 months (four years) of full-time study, encompassing 120 credit hours. Accelerated for-profit options can reduce completion time to 32 months, while community-college associate-to-bachelor transfer pathways typically take 24 months plus two additional years.
What GPA do students need for admission to US online college programs in 2026?
Minimum GPA cut-offs for online programs in 2026 vary by institution type: public four-year colleges generally require a 2.5 GPA, private nonprofits typically demand 2.75 or higher, and for-profit online universities admit students with a 2.0 minimum. Acceptance rates range from 57% at selective privates to 92% at for-profits.
Is an online degree worth the cost compared to traditional on-campus programs in 2026?
Yes, according to 2026 ROI data. Online bachelor's degree holders earn approximately $185,000 more over ten years than high-school-only peers at public institutions, and $215,000 more from private nonprofit degrees. While tuition averages $46,200 at public schools, the lifetime earnings premium delivers measurable career advancement value.
Strategic Final Takeaway
Success in evaluating 2026 Online Education Benchmarks: Metrics US Colleges Must Track relies on early preparation, adherence to verified accredited requirements, and cross-referencing official portals. Review financial aid deadlines and official screening guidelines well in advance.