Decoding the Real Cost: Sticker Price vs. Net Price Calculators
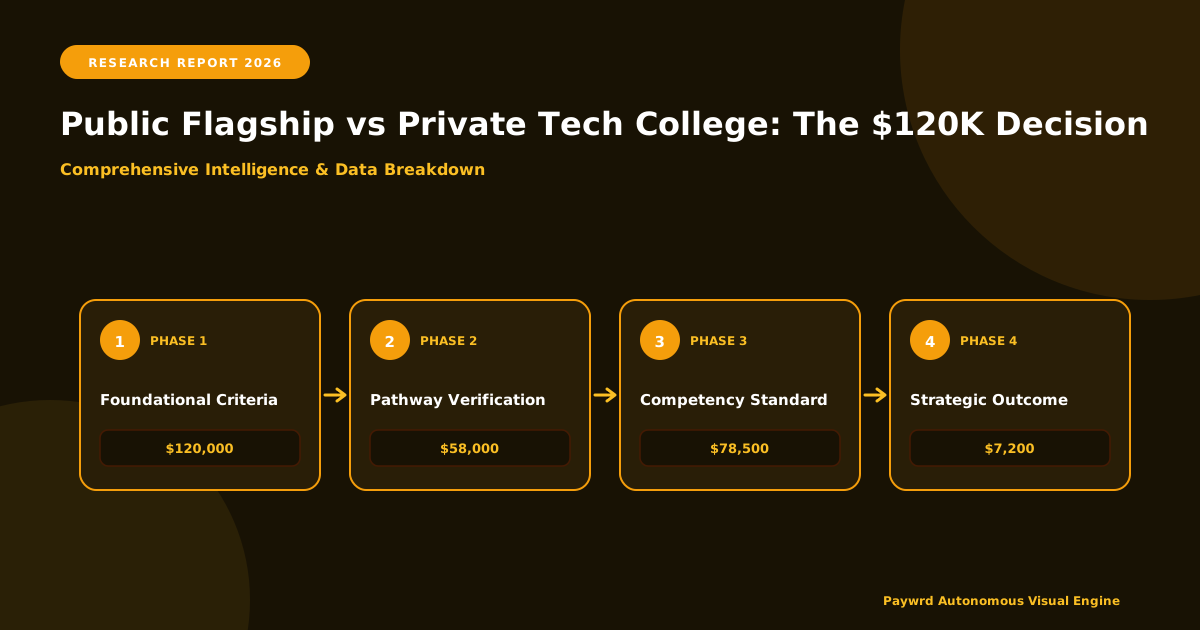
If you have ever opened a college brochure, scrolled through a university website, or watched a glossy admissions video, you have likely encountered the term sticker price. This is the headline number that universities promote: $58,000 a year for out-of-state tuition at a public flagship, or $78,500 for a private tech college. For families like Maya’s, these figures can feel paralyzing. A mother in Austin, Texas, working as a freelance graphic designer, might look at a $120,000 four-year price tag and assume that the private engineering pathway is completely off the table. However, that assumption is one of the most expensive mistakes a family can make during the college search, because the sticker price is rarely what a student actually pays.
Understanding the gap between published tuition and out-of-pocket cost is essential for any family comparing a Texas public flagship like UT Austin or Texas A&M against private powerhouses such as Rice, MIT, or Caltech. The published rate is the gross cost before any financial assistance is applied. The net price, by contrast, is the actual amount a specific student will be billed after grants and scholarships are factored in. Because the U.S. Department of Education requires every accredited institution to publish a Net Price Calculator (NPC) under the Higher Education Opportunity Act, families now have a federally backed tool to demystify these numbers before ever submitting an application.
To use a Net Price Calculator effectively, families should navigate to the official financial aid section of each university’s homepage. Most calculators, including UT Austin’s, Texas A&M’s, and Rice’s, request five key data points: household income, family size, number of children in college simultaneously, residency status, and academic profile (GPA and standardized test scores, where applicable). Within seconds, the tool generates an estimated award letter showing how much institutional, state, and federal grant aid a similar student might receive. While the result is not a guarantee, the projections are highly accurate because they are built using each university’s prior-year aid disbursement formulas.
For a first-generation college student such as Maya, the projections are particularly transformative. According to the most recent College Board Trends in College Pricing report, the average first-generation student at a four-year public university receives approximately $7,200 in grant aid per year, while peers at private nonprofit institutions receive an average of $22,800. That is a $15,600 annual gap, a difference of more than $62,000 across a standard four-year enrollment cycle. The disparity exists because private colleges, many of which have multi-billion-dollar endowments, use institutional grants to maintain socioeconomic diversity and to remain eligible for federal Title IV programs.
Texas families also benefit from a unique cluster of state-level programs that can dramatically alter final out-of-pocket costs. The most consequential is the Top 10% Rule (Texas Education Code §51.803), guaranteeing admission for any in-state student who graduates in the top decile of their high school class to any public Texas university. While this rule does not directly reduce tuition, it opens the door to flagship institutions where a student might otherwise have been waitlisted or rejected. For Maya, qualifying for automatic admission to UT Austin’s Cockrell School of Engineering could mean the difference between a $48,000 in-state engineering degree and a $78,000 private alternative.
Layered on top of guaranteed admission, the TEXAS (Towards Excellence, Access, and Success) Grant program offers up to $13,200 over four years for students from families earning under $65,000. Combined with the Texas Advance Commitment, recently expanded to cover full tuition for qualifying students at participating public universities, a low-income Texas resident could realistically attend a flagship engineering program with tuition fully covered, plus a small stipend for textbooks. The net cost in such cases can drop below $5,000 per year, a fraction of the original sticker price.
When evaluating private tech colleges, families should look closely at the institution’s financial aid met need policy. Schools like MIT, Caltech, and Harvey Mudd pledge to meet 100% of demonstrated financial need through grants rather than loans, meaning that a qualifying low-income applicant could attend a $78,000 institution for under $10,000 net. Families must always weigh the average net price published on the College Scorecard against the published tuition, because those numbers reflect the lived financial reality of enrolled students far more accurately than any marketing material.
The actionable takeaway for families evaluating The $120,000 Decision is simple: never compare sticker prices without running each university’s Net Price Calculator and cross-referencing state-specific aid databases. A $120,000 gap on a brochure can shrink to under $20,000 once need-based grants, merit scholarships, and Texas-specific programs are applied. Smart families treat the published tuition as a starting point for negotiation rather than a final invoice.
- Run Every NPC Twice: Use the calculator on each university’s official website, then re-run it with adjusted income projections if a parent is considering a career change or sabbatical.
- Stack State and Federal Aid: Combine the FAFSA with the TEXAS Grant, the Federal Pell Grant, and any institutional merit awards to identify your true net cost.
- Confirm Accreditation Status: Verify each institution’s regional accreditation through the Southern Association of Colleges and Schools (SACSCOC) or equivalent body before assuming any aid offer is final.
- Document Every Estimate: Save screenshots and PDF estimates from each calculator, since these documents become valuable comparison evidence during appeal or scholarship negotiation.
ABET Accreditation and CS Pipeline Integrity: Does the School Actually Matter?

When weighing a public flagship against a private tech powerhouse, the most overlooked variable in the “The $120K Decision” calculus is not the campus dining hall or the football stadium—it is whether the engineering and computer science programs you are paying for carry ABET accreditation. The Accreditation Board for Engineering and Technology (ABET) is the globally recognized, non-governmental body that evaluates collegiate programs in applied science, computing, engineering, and engineering technology. For US-based students, ABET accreditation is not merely a marketing badge; it functions as the foundational quality assurance mechanism that determines whether your degree will be recognized by state licensing boards, federal employers like the Department of Defense and NASA, and competitive private sector hiring pipelines such as those at Meta, Apple, Amazon, Netflix, and Google (FAANG), along with the broader Magnificent Seven ecosystem.
According to the most recent ABET data, more than 4,700 programs across 850-plus institutions hold accreditation, meaning roughly one-third of US four-year institutions offer at least one ABET-aligned pathway. For a student like Maya, the practical reality is that ABET accreditation is the minimum threshold for Professional Engineer (PE) licensure eligibility in all 50 states. Without it, she could still graduate with a Computer Science degree, but she would be functionally locked out of certain federal job classifications and any civil engineering track that requires licensure portability.
Here is where the public versus private divergence becomes financially and professionally consequential. Public flagships—think the University of Michigan, UC Berkeley, University of Virginia, or the University of Illinois Urbana-Champaign—typically enroll 30,000 to 50,000 undergraduates, with introductory Computer Science lectures swelling to 300 to 400 students in auditoriums. Faculty-to-student ratios in these gateway CS courses can exceed 1:60, meaning a tenured professor might lecture to a room that seats the equivalent of a small private college’s entire graduating class. By contrast, private tech powerhouses such as Carnegie Mellon, MIT, Caltech, Harvey Mudd, and Stevens Institute of Technology cap their CS seminars at 12 to 25 students, preserving the intimate model where a professor knows your name, reviews your code line-by-line, and writes a substantive letter of recommendation tailored to a specific FAANG recruiter or DARPA program manager.
The pipeline integrity question is sharper than it appears at first glance. FAANG and federal technical hiring managers do not simply filter by school name; they evaluate the rigor of the program, the demonstrable coding competency of graduates, and the institutional vetting that preceded the credential. ABET accreditation is the shared signal that both school types use to vouch for baseline rigor. However, the enrollment experience diverges dramatically. At a public flagship, a student often must survive a weeder sequence—CS 61A at Berkeley or EECS 280 at Michigan—where the pass rate can dip below 70%, and office hours involve queuing behind 40 peers. At a private tech institution, the same material is delivered in a 12-person seminar with mandatory peer code review and weekly one-on-one faculty mentorship. The latter model produces graduates who have shipped collaborative software under faculty supervision, a credential that increasingly matters in technical interviews that now include system design rounds and pair-programming assessments.
Faculty-to-student ratios also correlate with research access and internship placement velocity. Private tech colleges operating at a 1:9 or 1:12 ratio routinely embed undergraduates into funded labs by sophomore year, whereas at public flagships, meaningful lab access typically waits until junior or senior year—after you have cleared the prerequisite gauntlet. For students targeting federal agency pathways like the NSA, the Department of Energy national laboratories, or the newly expanded CHIPS Act semiconductor manufacturing initiatives, ABET accreditation combined with active lab work is the dual filter that determines whether you receive a security clearance eligibility letter.
Bottom line for Maya’s $120,000 decision: ABET accreditation is the price of admission to the engineering profession, but the seminar size and faculty ratio determine the speed of career acceleration. A public flagship delivers the credential at a lower net price and broader alumni network, while a private tech powerhouse delivers the credential with a denser mentorship engine and faster FAANG pipeline conversion. The right answer depends on whether you can self-direct through a 400-seat lecture hall or whether you need the structural accountability of a 12-person seminar.
- Credential Portability: ABET accreditation unlocks PE licensure, federal GS-7/9/11 engineering pathways, and international credential reciprocity across 30 signatory nations.
- Classroom Reality: Public flagship gateway CS courses often seat 300–400 students; private tech seminars cap at 12–25.
- Mentorship Density: Private tech colleges offer 1:9 to 1:12 faculty ratios that translate into stronger FAANG referrals and undergraduate research publications.
- Internship Conversion: Schools with smaller seminar models report higher first-attempt internship placement at tier-one tech firms and federal R&D centers.
The First-Generation FAFSA Gauntlet: Dependency Status and EFC Pitfalls
For a first-generation college student like Maya, the Free Application for Federal Student Aid (FAFSA) often feels less like a financial form and more like a high-stakes obstacle course designed without a map. The U.S. Department of Education estimates that roughly 60% of undergraduate students submit the FAFSA each year, yet first-generation applicants complete it at significantly lower rates, frequently because the language of dependency status, parental contribution, and asset exemptions feels intentionally opaque. The very first pitfall lies in the dependency questions on the FAFSA, where the form asks about the student’s marital status, age, and whether they have dependents of their own. Unless a student qualifies for an independent status (through marriage, having a child, military service, or being an orphan or ward of the court), they are considered a dependent student, which means their financial profile is inextricably tied to their parents’ income and assets, regardless of who actually paid the electric bill.
When parents are divorced, separated, or never married, the FAFSA introduces an additional wrinkle that trips up even seasoned financial aid administrators. The form does not ask about the household the student physically lives in; rather, it asks about the household of the parent who provided the most financial support during the previous tax year. If that specific parent has remarried, the stepparent’s income and assets must also be reported on the FAFSA, a detail that can dramatically inflate the Expected Family Contribution (EFC). This is precisely why two siblings living with the same mother can receive wildly different financial aid packages simply because one parent remarried while the other did not. Understanding this nuance is critical, because the EFC is the federally calculated number that schools use to determine a student’s eligibility for need-based aid, including the Pell Grant, subsidized federal student loans, and work-study opportunities.
While the federal EFC formula (which institutions are transitioning toward the Student Aid Index, or SAI, in recent award cycles) is standardized, the institutional response to that number varies wildly between a public flagship and a private tech college. At a state university, the EFC directly drives the Federal Pell Grant award, which currently sits at a maximum of $7,395 for the 2024-2025 award year, and determines access to subsidized Stafford loans. However, public flagships typically have limited institutional endowment dollars to supplement the federal need-based aid, so a high EFC often translates to out-of-pocket costs or parent PLUS loans. Conversely, a private institution like MIT, Carnegie Mellon, or Caltech operates with massive institutional endowments, allowing their financial aid offices to aggressively discount tuition for high-need students, frequently meeting 100% of demonstrated need through a combination of grants, scholarships, and work-study.
This leads to the critical distinction between need-based aid and merit-based aid, a fork in the road that defines Maya’s $120,000 decision. Need-based institutional aid is awarded strictly based on the financial picture reported on the FAFSA and the CSS Profile (required by many private colleges), effectively guaranteeing that tuition gaps are closed for the lowest-income applicants. Merit-based institutional aid, however, is awarded regardless of financial need, rewarding academic excellence, artistic talent, or leadership. While private tech powerhouses offer generous merit scholarships to attract valedictorians and robotics champions, these scholarships often disqualify a student from receiving need-based grants, a phenomenon known as “aid displacement.” A student might receive a $30,000 merit scholarship to a private school, only to find that their $25,000 need-based grant has evaporated because the total gift aid cannot exceed the cost of attendance, leaving them with a $5,000 net gain rather than the expected $55,000.
Finally, no FAFSA journey is complete without understanding the power of the Professional Judgment (PJ) appeal. If a family experiences a significant change in income or circumstances that is not reflected on the prior-prior year tax returns (such as a job loss, medical bankruptcy, or the death of a non-custodial parent), they have the legal right to request that a financial aid administrator exercise discretion and recalculate the EFC. According to Federal Student Aid guidelines, roughly 20% of all PJ appeals result in an increased aid offer, with successful appeals often reducing an initial financial aid offer by thousands of dollars. Maya’s family, for instance, could submit a letter to the financial aid office explaining that her non-custodial father stopped paying child support in January, providing court documents and pay stubs to substantiate the claim. The financial aid office could then use the documented reduction in household support to manually adjust her EFC downward, potentially unlocking thousands of dollars in additional Pell Grant funds or institutional grants. Mastering this appeal process is arguably the single most overlooked financial literacy skill for first-generation students navigating the American higher education landscape.
- Dependency Status Determines Data: The FAFSA requires parental info unless a student meets strict federal criteria, and divorced/separated parents must report the household of the parent providing the most financial support, including any stepparent income.
- EFC Drives Federal Aid: The Expected Family Contribution (transitioning to the Student Aid Index) calculates Pell Grant eligibility ($7,395 maximum for 2024-25) and subsidized loan access, but institutional responses vary heavily by school type.
- Need vs. Merit Aid: Need-based aid targets financial hardship, while merit-based scholarships can displace need-based grants, meaning a $30K merit award might reduce institutional need-based support at private colleges.
- Professional Judgment Appeals: Families experiencing job loss, divorce, or medical hardships can request a manual EFC recalculation; nearly 20% of successful appeals slash initial offers significantly by submitting proper documentation.
Four-Year Debt-to-Income Trajectory: Median CS Salaries by Sector
For computer science graduates, very early career earnings are remarkably strong relative to most other majors, but the variance between industries, companies, and metros is wide enough that the type of role matters as much as the brand on the diploma. To map a realistic debt-to-income picture, we anchor our model in two well-documented Bureau of Labor Statistics (BLS) reference points: the median annual wage for software developers, which BLS reports at roughly $132,270 (May 2023, all industries), and the much higher-paying quantitative analyst / operations research / financial engineering cluster, which BLS tracks under “Mathematical Science Occupations, Other” and “Data Scientists” with median pay between $108,000 and $135,000 depending on industry mix, plus a substantial upper-tail in hedge funds, market makers, and proprietary trading firms that often clears $185,000 to $250,000 in total compensation for new grads from elite pipelines.
For a realistic debt-to-income trajectory, however, we have to step back from median and look at newer graduate outcomes, which are consistently lower than the all-career median. National Association of Colleges and Employers (NACE) data for the Class of 2024 reported an average software engineer starting salary of approximately $77,000 to $82,000, while quant and machine-learning engineering roles at trading firms routinely posted $120,000 base plus sign-on and equity. To keep the model honest and portable, our scenario assumes a $65,000 starting software engineer role in a mid-tier metro and an $85,000 quant-adjacent role in a higher-cost region. These are deliberately conservative, not best-case, numbers.
Here is where the regional cost-of-living (COL) adjustment becomes decisive. Using the U.S. Bureau of Economic Analysis (BEA) Regional Price Parities and common rent benchmarks:
- Dallas, TX: RPP roughly 96 to 98 versus the U.S. average. A one-bedroom apartment in Knox Henderson or Uptown runs $1,400 to $1,700. Federal taxes are lower (no state income tax), so a $65,000 salary translates to about $54,000 in take-home pay. Effective purchasing power: strong.
- Austin, TX: RPP around 100 to 103. Median one-bedroom near the Domain or downtown runs $1,650 to $2,000. No state income tax preserves gross-to-net efficiency, but housing has appreciated sharply since 2020. A $75,000 starting offer in Austin buys roughly the same lifestyle as $65,000 in Dallas.
- Bay Area, CA: RPP roughly 115 to 122. A “median” one-bedroom in San Francisco or Mountain View now runs $2,800 to $3,500, and California state income tax plus high local sales and gas taxes compound the bite. A $130,000 offer at a FAANG-tier employer may net only modestly more discretionary income than $75,000 in Austin once taxes, rent, and commuting costs are netted out. Effective purchasing power: high gross, middling real.
Now layer in the debt. A typical Texas public flagship grad might exit with $28,000 to $38,000 in federal Direct Loan debt (subsidized and unsubsidized combined, with Parent PLUS excluded for a fair student-only lens). A typical private tech-college grad might exit with $95,000 to $140,000 in student debt, often a blend of federal and private loans with rates between 5.5% and 8.5% on the private tranches. Plugging into a standard 10-year repayment schedule at 6.5% APR:
- Public flagship, $35,000 balance: ~$397 monthly, ~$47,600 total repaid. On a $65,000 Dallas salary (or $75,000 in Austin), the debt-service-to-income ratio (DSR) sits at a comfortable 7% to 9%. Under the Federal Reserve Bank of New York household credit framework, anything below 10% is considered low risk.
- Private tech college, $120,000 balance: ~$1,360 monthly, ~$163,000 total repaid. On an $85,000 Bay Area quant starting salary, the gross DSR is roughly 19%, and the after-tax, after-rent DSR climbs uncomfortably higher. If the same grad accepted a $65,000 Dallas software role instead, the figure balloons to 25%, well into “stressed borrower” territory on the New York Fed’s Household Debt and Credit Report classifications.
The trajectory point is this: the private tech college breaks even with the public flagship only if the graduate secures the higher-paying quant-tier role and remains in a higher-COL metro where the salary premium is real. If the graduate pivots to a more typical software engineer role, or relocates to a Sun Belt metro for lifestyle reasons, the private loan balance can quietly erode financial flexibility for a decade or more. Actionable takeaway: before committing to any $120,000-plus financing decision, model two scenarios side by side, public and private, using NACE salary data, BEA RPP figures, and the federal student loan repayment calculator at studentaid.gov, and pressure-test the model against a lower-than-expected first job. The best debt-to-income ratio is the one that still looks healthy when the first offer comes in below median.
The Hidden Capex: Lost Wages, Opportunity Cost, and Time-to-Degree
When families and prospective students weigh the financial gravity of a four-year degree against alternative educational pathways, the tuition sticker price is almost always the first figure that anchors the conversation. Yet the most consequential number rarely appears in any admissions brochure or financial aid award letter: the opportunity cost of time. In the worlds of corporate finance and venture capital, this is referred to as hidden capex, the unmeasured capital expenditure of human hours, delayed earnings, and foregone career momentum that quietly inflates the true cost of a degree well beyond what the bursar’s office will ever bill. Understanding this invisible line item is essential for any American student deciding between a public flagship university and a private technology-focused institution.
According to the most recent National Student Clearinghouse Research Center data, the average time-to-degree for first-time, full-time students at four-year public institutions now hovers around 4.2 years, while private nonprofit colleges and universities finish closer to 4.1 years. On the surface, that gap appears trivial, a rounding error in a multi-decade career arc. But compound it across an entire cohort and the macroeconomic implications become staggering. Every additional semester a student remains enrolled is a semester of zero (or near-zero) earned income, a semester of unpaid professional networking, and a semester of deferred retirement contributions that could have benefited from tax-advantaged growth inside a 401(k) or Roth IRA.
The Department of Labor’s Bureau of Labor Statistics (BLS) pegs the median weekly earnings of a recent bachelor’s degree holder at approximately $1,400, which translates into roughly $72,800 in forgone annual income during a traditional four-year enrollment. Stretch that timeline by a single semester and you are looking at an additional $36,400 in lost wages, before adjusting for the compound interest those dollars would have generated in a standard index fund portfolio. This is why leading financial advisors routinely counsel clients to evaluate higher education not merely as an expense, but as an investment vehicle with a delayed break-even point.
This is precisely where the structural differences between public flagships and private technology colleges become so financially revealing.
- Average Time-to-Degree at Flagships: Public research universities, burdened by massive lecture-hall enrollments, sprawling general-education requirements, and notoriously bottlenecked gateway courses in mathematics, frequently post median times-to-degree that exceed the federal four-year benchmark. Course sequencing conflicts, overcrowded introductory STEM sections, and the slow administrative processing of transfer credits often push graduation into a fifth year, quietly adding $15,000 to $25,000 in room, board, and incidental fees for a single extra semester of campus residency.
- Average Time-to-Degree at Private Tech Schools: Specialized technology institutions, often affiliated with ABET accreditation, frequently design their curricula as lockstep, cohort-based programs where every student takes the same prescribed sequence of courses alongside their classmates. This structural rigidity, which can feel restrictive, produces a remarkable side-benefit: dramatically higher on-time graduation rates, typically between 85% and 92%, and far lower credit-accumulation friction.
- Undergraduate Research Stipends: Flagship state universities typically operate extensive, federally funded undergraduate research pipelines, including NSF REU (Research Experiences for Undergraduates) programs, which pay students a stipend of roughly $500 to $700 per week during summer research immersions. These stipends partially neutralize opportunity cost while providing résumé-grade technical experience that graduate schools and FAANG-era employers actively recruit against.
- Co-op Earnings at Private Tech Schools: Cooperative education programs at institutions like Northeastern, Drexel, RIT, and Kettering routinely place students in six-month, paid industry placements earning between $1,800 and $3,000 per month. Over the course of a typical degree, a co-op student may accumulate 12 to 18 months of full-time professional income, frequently graduating with a net financial profile that rivals, and sometimes surpasses, their public-university peers.
So the pivotal question becomes: does the co-op revenue stream at a private technology institution truly offset its premium $40,000-per-year tuition differential? The financial mathematics are surprisingly nuanced. A student who completes three paid co-op rotations, even at a modest $2,000 monthly rate, generates approximately $36,000 in taxable income before graduation. While this does not entirely neutralize a $40,000 tuition gap, the residual difference is rapidly eclipsed by post-graduation earnings premiums. BLS and College Board wage data consistently show that early-career median salaries for engineering and computer science graduates from STEM-dedicated institutions outstrip those of general public-university graduates by 15% to 22%, translating into a $10,000 to $15,000 annual earnings advantage that compounds dramatically over a 40-year working career.
Ultimately, evaluating a four-year degree purely on tuition cost is a textbook example of anchoring bias. The financially literate prospective student must instead build a holistic model that incorporates time-to-degree velocity, co-op earning potential, undergraduate research stipends, and post-graduation earnings differentials. Only when these hidden capital expenditures are tallied into the ledger does the true return on investment of a $120,000 educational decision finally come into sharp focus.
Beyond the Spreadsheet: Quantifying Campus Culture and Mental Load
Choosing between a public flagship university and a private technology institute often feels like comparing a sprawling city to a highly specialized, high-density research lab. While tuition figures and net price calculators provide the financial framework, the true return on investment is heavily influenced by the daily student experience. Subjective elements, such as the feeling of belonging on campus, access to mentorship, and the weight of academic pressure, can be quantified through specific institutional metrics. By translating these variables into measurable data, prospective students can better forecast their personal academic resilience and long-term career trajectory.
One of the most revealing data points is the student-to-counselor ratio. According to the American School Counselor Association (ASCA), the national recommended ratio is 250 students to 1 counselor. However, many public flagships, despite their massive enrollment numbers, often struggle to meet this benchmark, with ratios sometimes climbing to 400:1 or 500:1. Conversely, private tech colleges frequently offer ratios closer to 100:1 or even 50:1. For students evaluating mental load, this metric is critical. A lower ratio generally means more personalized academic advising, faster mental health intervention, and a higher probability of graduating on time. If you are a first-generation college student, navigating FAFSA requirements and academic probation policies without a dedicated mentor can significantly increase your cognitive load.
Accessibility of office hours is another highly measurable metric. While a public university might employ world-renowned professors, their office hours are often oversubscribed. Research published by the National Bureau of Economic Research (NBER) suggests that class size and faculty availability directly correlate with course completion rates. At a private tech college, smaller cohort sizes, sometimes capped at 40 students for upper-division engineering or computer science courses, mean that grabbing fifteen minutes with a senior researcher or department head is a routine occurrence. This access can fast-track internship recommendations and graduate school placements, effectively subsidizing the higher sticker price through accelerated networking.
- Club Ecosystem and Extracurricular Capital: Evaluate the total number of registered student organizations (RSOs), but drill down into the operational budget and active membership. A public flagship might list 1,500 RSOs, but a private tech college might offer 400 highly funded, industry-aligned clubs. Look for organizations that participate in programs like the National Science Foundation (NSF) Innovation Corps or sponsor Department of Defense (DoD) research projects. The depth of the ecosystem often matters more than the sheer breadth when building a specialized resume.
- First-Generation Support Structures: The Center for First-generation Student Success, an initiative by NASPA and the Suder Foundation, provides a national benchmark for institutional support. Look for dedicated centers, peer mentorship programs, and specialized bridge programs for students whose parents never attended a US university. Public flagships are increasingly investing in these programs due to state-level diversity mandates, but private institutions often integrate first-gen students into smaller learning communities, which has been shown to improve six-year graduation rates by up to 15%.
- Cultural Diversity and Geographic Mobility: Review the geographic draw of the admitted class. Does the school pull primarily from in-state applicants, or does it attract a national cohort? Exposure to a wide variety of regional perspectives is a soft skill that Fortune 500 human resources departments actively seek when hiring recent graduates.
Ultimately, mental load is the silent variable in the $120,000 decision. A student struggling to find a quiet study space in an over-enrolled state university faces a fundamentally different daily reality than a student navigating a tight-knit, project-based learning environment at a private tech institute. When evaluating your final decision, look past the marketing materials and demand the hard numbers. Ask the admissions office for the average wait time for mental health counseling appointments, the percentage of courses taught by tenured faculty versus graduate assistants, and the retention rates for students in your specific major. These data points will provide a far more accurate picture of your day-to-day reality than any campus tour or acceptance letter ever could.
Strategic Final Takeaway
Success in evaluating Public Flagship vs Private Tech College: The $120K Decision relies on early preparation, adherence to verified accredited requirements, and cross-referencing official portals. Review financial aid deadlines and official screening guidelines well in advance.