Why a 2026 Graduate School ROI Calculator Is Your Most Important Financial Decision Tool
Walk onto any college campus today and you will hear the same pitch: an MBA from a top-tier program will change your life. An MS in Computer Science from a flagship state school will future-proof your career. A doctorate in Nursing Practice will open six-figure doors. The problem? None of those promises come with a financial receipt. They are emotional arguments disguised as career advice, and they are precisely why smart mid-career professionals in 2026 are skipping the brochure and heading straight for a graduate school ROI calculator before they ever submit a FAFSA application through the US Department of Education portal.
The Great Pivot: From Prestige-Driven Applications to Data-Driven Enrollment
For decades, the graduate school decision revolved around brand. Ivy League, top-15, the “right” name on the diploma. In 2026, that calculus is broken. The Bureau of Labor Statistics consistently shows that while wages have grown, the median weekly earnings for a worker with a master’s degree only outpace bachelor’s degree holders by roughly 20%, not the 50% premium a generation ago expected. When you stack that against graduate tuition at accredited business schools (AACSB programs routinely clearing $80,000 per year) or engineering master’s degrees at ABET-accredited universities, the prestige premium stops justifying itself. Candidates are realizing that a state flagship with strong PMI-aligned industry connections or an employer tuition reimbursement program can deliver superior net present value without the brand tax.
Why Sticker Price Is the Most Dangerous Number in Your Decision
The advertised tuition at a private institution can shock you into paralysis, but it is almost never the number that actually hits your bank account. Mid-career professionals frequently ignore opportunity cost, which is the salary they surrender while enrolled, and that single figure often dwarfs the tuition bill. If you currently make $95,000 and a full-time master’s takes 18 months, your lost earnings plus tuition can easily exceed $175,000. A proper ROI calculator folds in the loan interest rates from current federal PLUS loans, your projected post-graduation salary (sourced from real BLS occupational outlooks), the probability of completion, and the discount rate that makes a future dollar worth less than a present one.
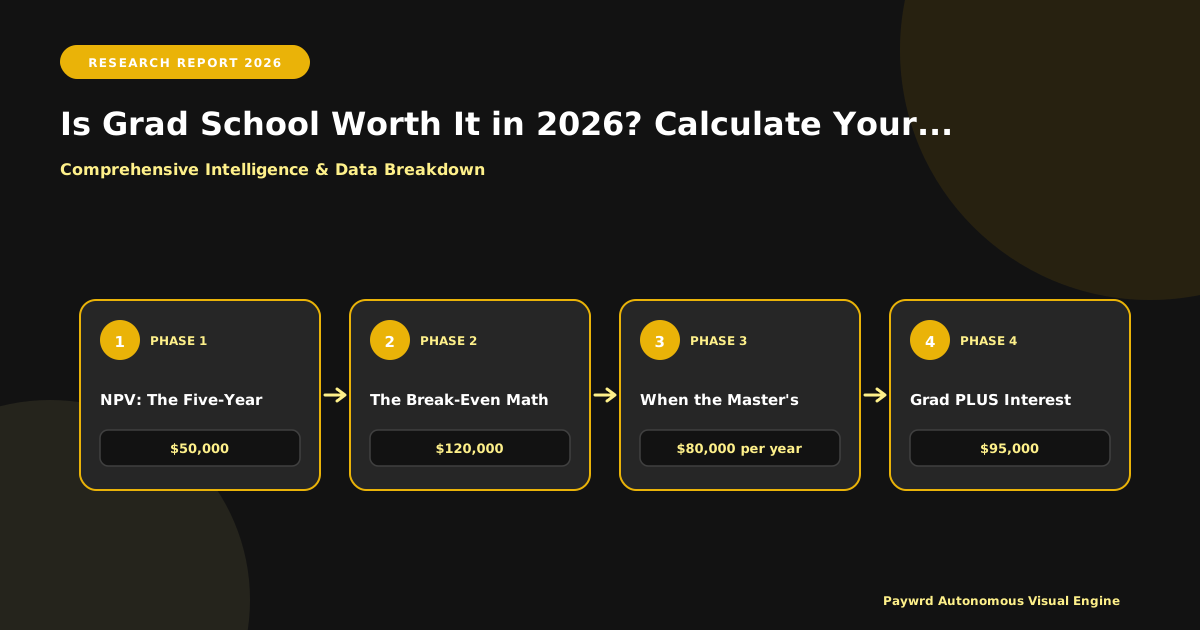
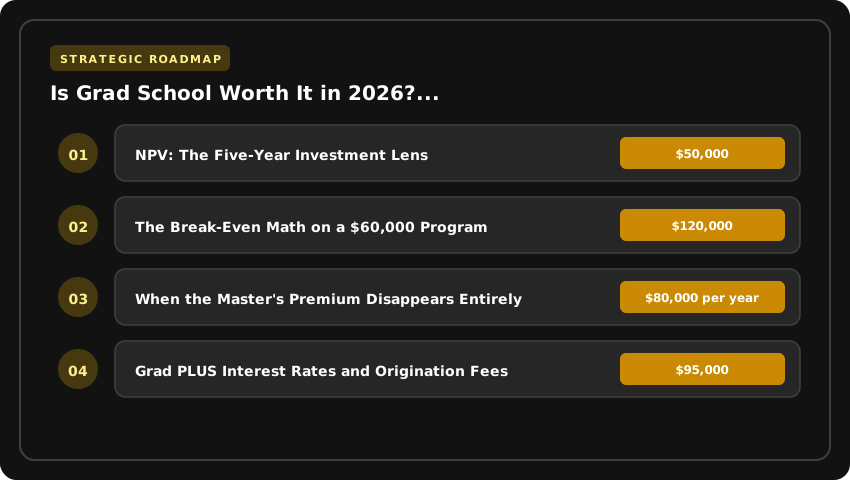
NPV: The Five-Year Investment Lens
Net Present Value modeling treats your degree like a portfolio holding. You are spending capital now in exchange for a defined cash flow uplift over the next 20 to 30 working years. When you discount those future earnings back to 2026 dollars at a reasonable rate, you discover the true yield of your education. A program that costs $60,000 but propels you from $70,000 to $105,000 within three years delivers an NPV that crushes a $40,000 program that leaves you earning $78,000 in a saturated field. The ROI calculator makes this comparison frictionless and forces you to ask the right question: not “Can I afford grad school?” but “What is the five-year return on this specific credential in my specific labor market?”
- Tuition reality check: Compare total program cost against your realistic post-graduation salary band, not the alumni brochure highlight reel.
- Opportunity cost audit: Include lost wages, forgone retirement contributions, and reduced Social Security accrual during enrollment years.
- NPV over IRR: Net Present Value gives you a clear dollar figure for comparison; Internal Rate of Return can mislead on short-duration programs.
- Field-specific risk: A computer science master’s from an ABET-accredited school carries different volatility than a humanities doctorate in 2026.
The bottom line is simple: the candidates winning in 2026 are the ones running their enrollment decision through a spreadsheet before they ever sign an enrollment agreement. Skip the calculator, and you are betting your career trajectory on a hope. Use it, and you are making a measured capital allocation decision with eyes wide open.
Breaking Down Fully Funded PhD Packages: Stipends, Tuition Remission, and Health Insurance
When admissions committees send you that glossy acceptance packet, the word “fully funded” feels like finding a winning lottery ticket under your driver’s seat. But smart candidates in 2026 know that a PhD funding package is not a single number. It is a stack of three very different financial instruments: a monthly stipend, tuition remission, and a health insurance subsidy. Each one behaves differently on your personal balance sheet, and macroeconomic headwinds are actively reshaping how generous these packages look when you peel back the sticker.
How NIH and NSF Research Assistantship Freezes Are Reshaping 2026 Funding Offers
For decades, the National Institutes of Health (NIH) and National Science Foundation (NSF) set the gravitational pull for nearly every R1 stipend. Their 2024 to 2026 appropriations debates have produced real friction: while the NIH maintained an NRSA stipend base near $28,224 for predoctoral fellows, many university research assistantship (RA) lines funded through these agencies were held flat or shifted toward partial-year appointments. If your offer letter arrives with an 11-month rather than 12-month guarantee, that lost month equals roughly $3,000 to $3,800 in real purchasing power. Ask the graduate program coordinator directly: is this line NIH or NSF-backed, departmental, or grant-specific from a single principal investigator?
The Realistic Value of a $38,000–$45,000 Stipend When Adjusted for Cost of Living
A $45,000 stipend in Champaign, Illinois is not the same animal as a $38,000 stipend in Boston or San Francisco. The Bureau of Labor Statistics (BLS) Consumer Expenditure Survey places average annual living costs for a single renter in the lowest-cost metros near $28,400 and in the highest near $42,500. Run that math honestly. At $38,000 in a high-cost zip code, your discretionary income can evaporate before you finish unpacking your kitchen boxes. A realistic 2026 budget worksheet should reserve roughly 30% for housing, 12% for food, 8% for transportation, and a minimum 5% buffer for mental health days, conferences, and visa fees for international students. If your projected annual surplus falls below $2,000, the offer is technically funded but financially fragile.
Tuition Remission as a Non-Cash Benefit Worth $50,000+ Per Academic Year
This is the line item most candidates dramatically undervalue. When a graduate school “remits” tuition, the university is quietly absorbing a charge that, at a private Ivy, frequently exceeds $62,000 annually, and even at a top public R1 like UC Berkeley or the University of Michigan can clear $32,000 to $48,000 for out-of-state graduate students. That remission is not taxable income under most circumstances, but it is absolutely a real cost avoided. Treat it on your spreadsheet as a phantom salary line. Over a typical five-to-six-year PhD horizon, tuition remission alone can represent $250,000 to $372,000 in avoided expenses, the single largest component of your total compensation package.
Comparing Ivy League, R1 Public, and ABET-Accredited Program Funding Competitiveness
Not every “fully funded” offer carries the same weight. Ivy League and elite private programs tend to bundle the highest tuition remission values with mid-tier stipends, while top R1 publics like UCLA, UW-Madison, or Georgia Tech often counter with stronger RA stipends but lower remission totals. ABET-accredited engineering doctorates frequently layer in industry-funded supplements, corporate fellowships, or engineering research center grants that can boost annual take-home by $4,000 to $10,000 above the standard package. Always request a side-by-side table from every program: stipend amount, months of guaranteed support, remission value, insurance premium coverage, and travel/conference budgets. The school that wins on paper is rarely the one with the highest stipend, it is the one with the most balanced four-pillar structure over the full program length.
Master’s Degree Salary Increase: What BLS Data Actually Predicts for 2026 Graduates
Let’s cut through the marketing brochures and talk about what actually happens to your paycheck when you add those three little letters after your name. The Bureau of Labor Statistics has been tracking the wage premium attached to graduate degrees for decades, and the 2024 Occupational Employment and Wage Statistics release (the freshest dataset shaping 2026 hiring forecasts) reveals a far more uneven landscape than most enrollment advisors will admit over a campus tour.
The headline figure is seductive: workers with a master’s degree earn a median annual salary of $81,848, compared to $51,124 for those holding only a bachelor’s. That looks like a $30,724 raise on paper. Hold on before you start shopping for programs, though. That median obscures enormous variance across disciplines, and it completely ignores the two to four years of foregone earnings you spend sitting in a seminar room instead of collecting a paycheck.
Field-by-Field Wage Premiums That Actually Move the Needle
Not every graduate degree is created equal, and the BLS data proves it dramatically. Computer and information research scientists with a master’s pull in a median $145,080 annually, while nurse practitioners command $129,480, and architectural and engineering managers average $167,740. An MBA from an AACSB-accredited program in finance or marketing management routinely pushes mid-career earnings above $135,000 within five years of completion.
- Computer Science (MS): $145,080 median; software developers with graduate credentials routinely out-earn bachelor’s peers by 22 to 31 percent.
- Engineering (MS):strong> $107,830 median across sub-fields; petroleum and aerospace engineering managers exceed $180,000.
- Nursing (MSN/NP): $129,480 median for nurse practitioners; demand projections through 2034 sit at a scorching 40 percent growth rate.
- MBA: $109,920 median for general management; specialized concentrations in finance, consulting, and tech strategy frequently push total compensation past $160,000 once bonuses and equity vest.
The Break-Even Math on a $60,000 Program
Here is where the romantic notion of graduate school collides with a spreadsheet. If you borrow $60,000 at the current federal graduate student loan rate (7.54 percent for Direct Unsubsidized Loans disbursed in 2024-25), you will owe roughly $710 monthly over a standard 10-year repayment horizon. Factor in the FAFSA-reported average two years of lost wages (approximately $102,248 if you were earning the bachelor’s-degree median during grad school), and your true break-even point on a $60,000 program lands somewhere between 4.5 and 6.5 years post-enrollment, assuming you land a role paying even a modest 15 percent premium over your pre-grad-school salary.
When the Master’s Premium Disappears Entirely
The honest truth that glossy viewbooks never print: in certain occupations, the master’s credential produces zero statistically significant wage lift. BLS data shows that graphic designers, writers and authors, and many social work roles pay nearly identical salaries regardless of whether the worker holds a bachelor’s or a master’s. If you are eyeing a credential in one of these flat-premium fields, run your numbers with extreme skepticism. A master’s degree fails to produce meaningful ROI when the occupation doesn’t gate promotions behind the credential, when the field is oversaturated with new graduates, or when the wage distribution simply doesn’t reward the extra years of specialization. Before you sign that enrollment agreement, check the actual occupational wage data, model your break-even timeline honestly, and confirm that your target industry actually pays for the credential you are about to chase.
Federal Direct Unsubsidized and Grad PLUS Loan Modeling for 2026-27 Academic Year
Running an honest ROI calculation in 2026 starts with the cold reality of what Uncle Sam will actually lend you, and exactly what that capital costs in real dollars. Federal loans remain the cheapest risk-adjusted debt for the vast majority of graduate students because they offer income-driven repayment, generous deferment, and flexible forgiveness pathways that no private lender can match. Let’s break down the modeling mechanics so you can plug real numbers into your spreadsheet instead of guessing.
2026-27 Direct Unsubsidized Loan Rates and Aggregate Limits
Federal Direct Unsubsidized Loans for graduate students are projected to price around 7.5% to 8.0% APR for the 2026-27 cycle, based on the trailing 10-year Treasury yield plus the statutory 3.60% add-on for graduate borrowers. This rate is fixed for the life of the loan, a critical advantage when modeling 10-year cash flows. The aggregate borrowing ceiling for graduate students sits at $138,500, which includes any prior undergraduate Direct Loans. For most MBA, MS, or law candidates, this cap is not the binding constraint; Grad PLUS eligibility is.
Grad PLUS Interest Rates and Origination Fees
Grad PLUS loans are projected to clear 8.5% APR in 2026-27 and carry an origination fee of roughly 4.228% of the disbursed principal. That fee is deducted at disbursement, so a $50,000 Grad PLUS actually delivers about $47,886 to your university. Always model the gross loan amount needed to cover tuition plus fees plus the origination haircut, otherwise your final semester runs short.
Standard Versus PAYE/SAVE Repayment Modeling
The standard 10-year repayment plan builds an amortization schedule with a fixed monthly principal and interest payment, roughly $1,250 per month on a $100,000 unsubsidized balance at 7.75%. Run that same balance through a PAYE (Pay As You Earn) or revised SAVE plan projection and the first-year payment may drop to 5% of discretionary income, potentially $0 to $400 depending on your salary. The trade-off is negative amortization: unpaid interest capitalizes, extending the payoff window to 20 or 25 years.
Stress-Testing ROI Against a 7.5% Discount Rate
Here is the modeling framework that separates the analysts from the optimists:
- Step 1: Sum total federal borrowing across unsubsidized and Grad PLUS, including the 4.228% origination fee adjustment.
- Step 2: Build a standard 10-year amortization schedule at the fixed loan rate.
- Step 3: Discount all future monthly payments back to present value using a 7.5% discount rate, which approximates the S&P 500’s long-term real return.
- Step 4: Compare that true present-value cost against the projected post-graduation salary lift over the same decade.
If the discounted cost of debt exceeds the discounted salary gain, the degree fails the stress test regardless of how prestigious the program looks on LinkedIn. If the salary lift clears the 7.5% hurdle by a wide margin, you have a defensible investment thesis worth borrowing against.
Net Present Value Analysis: How to Model a Graduate Degree Over a 20-Year Career Horizon
Most prospective students stare at the sticker price—often $60,000 to $120,000 for tuition alone—and freeze. But the real cost of a graduate degree isn’t the tuition bill; it is the opportunity cost of foregone earnings. If you earn $85,000 annually in your current role and enroll in a two-year MBA, you aren’t just spending $150,000 on school. You are sacrificing $170,000 in pre-tax income. That pushes the true two-year investment north of $320,000 before you collect a single diploma. A Net Present Value (NPV) model forces that reality into a single, comparable dollar figure today.
Step 1: Set Your Discount Rate—The “Hurdle” for Human Capital
You cannot compare a dollar spent today with a dollar earned in 2035 without a discount rate. For human capital investments, the U.S. Treasury 10-year yield plus a risk premium is the standard benchmark. In the current 2026 rate environment, a 3.5% to 5.0% discount rate is defensible. Use 3.5% if you are entering a stable, regulated field like nursing or public accounting where wage paths are predictable. Push to 5.0% for volatile sectors like tech product management or early-stage biotech, where the “beta” of your future earnings stream resembles a growth stock more than a bond.
Step 2: Model the Cash Outflows (Years 0–N)
Build a year-by-year column in Excel or Google Sheets. Outflows include:
- Direct Costs: Tuition, mandatory fees, health insurance (often $3,000–$5,000/yr if not covered), and books.
- Living Expenses: Rent and food minus what you would spend anyway.
- Foregone Gross Income: Your current salary + expected raises + employer 401(k) match + bonus potential.
- Tax Shield Adjustment: Deduct the tax savings from losing that income (roughly 22–32% federal marginal rate plus state). This softens the blow slightly.
Step 3: Project Inflows with Industry-Specific Trajectories
Do not plug in the BLS Occupational Outlook Handbook median wage and call it a day. The median masks massive variance. An MBA from a Top 15 program commands a $160,000–$190,000 base plus signing bonus; a lower-tier program might yield $95,000. Adjust BLS projections by:
- Program Prestige Multiplier: Compare your target school’s employment report against the national median.
- Wage Growth Slope: Engineering and CS roles often see 4–6% real wage growth annually for the first decade. Education and social work often track 1–2% (barely above inflation).
- Terminal Value: Calculate the present value of the earnings differential from Year 10 to Year 20. That “tail” often determines if the NPV is positive.
Step 4: Identify the “Negative NPV” Danger Zones
The model turns negative when the cumulative discounted outflows exceed the discounted incremental earnings over 20 years. This happens frequently in three scenarios:
- High-Cost / Low-Lift Degrees: A $80,000 Master’s in Humanities leading to a $5,000 salary bump.
- Extended Time-to-Degree: Part-time programs stretching to 4–6 years double the foregone earnings drag without accelerating the payoff.
- Mid-Career Pivots: If you are 40+, your “investment horizon” shrinks. You have fewer years to amortize the fixed cost of tuition.
Run the sensitivity table. If your NPV breaks even only at a 2% discount rate with 6% wage growth, the degree is a speculation, not an investment. Walk away—or negotiate a fellowship that flips the math.
2026 Funding Climate: How NIH and NSF Research Freezes Impact Assistantship Availability
The federal research apparatus that powers most R1 graduate stipends is currently running on a continuing resolution, not a settled budget. For the 2025–2026 cycle, the National Institutes of Health (NIH) and the National Science Foundation (NSF) have both signaled flat-funding or low-single-digit increases that fail to keep pace with the biomedical inflation index. In practical terms, a Principal Investigator (PI) holding an R01 grant renewed at 2023 levels has roughly 15% less purchasing power for personnel today. The first line item they cut? New Research Assistants (RAs).
Which Disciplines Face the Highest Scarcity Risk
The pain is not distributed evenly. If you are targeting a PhD in biological sciences, computational biology, or clinical psychology, you are competing for a shrinking pool of NIH training grants (T32s) and F31 fellowships. Engineering disciplines reliant on NSF Directorate for Engineering (ENG) awards—specifically civil, mechanical, and materials science—are watching proposal success rates hover near historic lows, often below 16%. Conversely, Computer Science, Data Science, and AI-adjacent fields are partially insulated by massive industry partnerships (Google, NVIDIA, DoD contracts) that bypass federal appropriations entirely. Humanities and social sciences, historically dependent on university central funds rather than grant overhead, face a different crisis: endowment payout caps limiting new Graduate Teaching Assistant (GTA) lines.
Securing External Fellowships: Your Best Hedge
Relying solely on a departmental offer letter in 2026 is a liability. You need portable, prestigious money that follows you regardless of your PI’s grant status. Prioritize these three targets:
- HHMI Gilliam Fellowships: $53,000 annual stipend plus $10,000 allowance. Deadline typically September. Requires a thesis mentor committed to diversity excellence—start that conversation with potential advisors before you apply.
- Ford Foundation Fellowships: Administered by the National Academies. Predoctoral awards offer $27,000/year for three years. The “personal statement on diversity” prompt is weighted heavily; treat it as a policy memo, not a memoir.
- Private Foundations (Hertz, NDSEG, Paul & Daisy Soros): The Hertz Fellowship provides up to $38,000/year plus full tuition for five years in applied physical sciences. NDSEG (DoD) covers 15 disciplines critical to national defense with a $40,800 stipend. These are citizenship-restricted but offer zero service obligation post-graduation.
Negotiating Stability Clauses Before You Sign
Once you have an offer—and ideally a competing offer—you negotiate the contract language, not just the stipend number. Ask the Director of Graduate Studies (DGS) to insert a “Funding Continuity Guarantee” into your appointment letter. Specific clauses to request:
- Bridge Funding Commitment: “If external grant support terminates, the department guarantees 12 months of equivalent GTA/RA support at the current stipend level ($34,000–$42,000 depending on program) to allow degree completion.”
- Tuition Remission Lock: Explicit confirmation that tuition remission remains active regardless of appointment type (RA vs. GTA vs. Fellowship) for the normative time-to-degree (typically 5 years).
- Health Insurance Subsidy Floor: Guarantee that the university subsidy percentage (often 85–95% for student health plans) cannot decrease year-over-year.
Get these commitments in writing—email from the DGS or Graduate School Dean counts. Verbal assurances from a PI evaporate the moment their R01 score drops from the 10th to the 25th percentile. In the 2026 climate, your funding security is only as strong as the contract clause backing it.
Building Your Custom 2026 ROI Spreadsheet: Inputs, Formulas, and Sensitivity Testing
Stop guessing and start modeling. A proper ROI spreadsheet isn’t a budget; it’s an investment thesis. Open a fresh Google Sheet or Excel workbook and build these five non-negotiable input tabs first. Hard-code your assumptions in a distinct Assumptions sheet so you can stress-test them later without breaking formulas.
Essential Input Variables
- Total Direct Cost: Tuition + mandatory fees + health insurance + books. Pull the 2025-26 published rates from the bursar’s office, not the admissions brochure. For a top-20 MBA, this often exceeds $85,000 per year; for a public Master’s in Engineering, it might land near $18,000 (in-state) versus $38,000 (out-of-state).
- Funding & Stipends: Enter every guaranteed dollar—fellowships, graduate assistantships (often $20,000–$35,000 + tuition remission), employer tuition reimbursement (capped at $5,250 tax-free annually), and VA Yellow Ribbon matches. Subtract this from Direct Cost to get your Net Cash Outflow.
- Loan Terms: Model Grad PLUS loans at the fixed 8.05% rate (2024-25 baseline) plus the 4.228% origination fee. Include private loan scenarios if your credit qualifies for sub-7% rates.
- Projected Post-Grad Salary: Use BLS Occupational Employment and Wage Statistics (OEWS) 75th-percentile data for your target role and metro, not the program’s “median reported salary” (which suffers from selection bias).
- Discount Rate: Set a baseline of 5% (approximating long-term S&P 500 real returns) to calculate Net Present Value (NPV). This represents your opportunity cost of capital.
Scenario Modeling: High, Base, Low
Don’t rely on a single salary figure. Build a Data Table (Data > What-If Analysis) linked to your salary input cell. Run three columns:
- High (75th %ile): You land the FAANG product role or Big Law associate spot.
- Base (Median): The typical outcome for your program’s employment report.
- Low (25th %ile / Unemployed 6mo): The “oh no” scenario—critical for stress-testing debt service coverage ratios (DSCR).
Output rows for each scenario: 5-Year Cumulative Net Cash Flow, NPV, IRR, and Payback Period. If the Low scenario shows a negative NPV at Year 5, you have a capital preservation problem, not just a return problem.
Geographic Cost-of-Living Arbitrage
A $160,000 salary in Boston (COL index ~150) equals roughly $115,000 in Austin (COL index ~110) and $125,000 in Chicago (COL index ~120). Add a COL Adjustment Factor column. Multiply your projected salary by (Target City Index / Program City Index). A program in a high-COL city often forces higher borrowing just to survive, dragging down ROI versus a comparable program in a lower-COL hub where you can bank the spread.
Red Flag Metrics: Walk Away Before You Deposit
- Debt-to-Income (DTI) > 1.5x: If total loan balance at graduation exceeds 1.5x your Base case Year 1 gross salary, you risk failing the Federal Direct Consolidation or IDR affordability tests.
- Payback Period > 7 Years: The average career pivot takes 3–5 years to compound. A 7+ year breakeven eats your prime compounding decade.
- Negative NPV in Base Case: If the NPV at a 5% discount rate is negative, you are mathematically better off investing the tuition difference in an S&P 500 index fund and staying in your current role.
- Program Non-Completion Rate > 15%: Check College Scorecard data. High attrition destroys ROI because you keep the debt but lose the credential.
Lock this model down before you pay the enrollment deposit. If the numbers don’t work in the Low scenario, negotiate more aid or choose a different program. Your future self will thank you for the discipline.
| Program Type | Avg Total Cost (Tuition + Fees) | Typical Admission Cutoffs (GPA / Test) | Avg Time to Degree (FT) | Median Starting Salary (2024-25 Data) | 5-Year Net ROI Estimate* | Funding Availability |
|---|---|---|---|---|---|---|
| Top-Tier MBA (M7/T10) | $160,000 – $220,000 | 3.6+ GPA / 720+ GMAT / 325+ GRE | 2 Years | $175,000 + $30k Signing Bonus | $350k – $550k | Low (Merit Fellowships 15-25%) |
| Flagship State MS in CS | $40,000 – $70,000 (In-State) | 3.3+ GPA / 320+ GRE (Often Waived) | 1.5 – 2 Years | $125,000 – $160,000 | $450k – $650k | Moderate (RA/TA Stipends + Tuition Waivers) |
| Online MS Data Science / Analytics | $25,000 – $45,000 | 3.0+ GPA / No Test Required | 1 – 2 Years (Part-Time) | $105,000 – $135,000 | $400k – $550k | Low (Employer Tuition Assistance Common) |
| DNP (Doctor of Nursing Practice) | $50,000 – $90,000 | 3.2+ GPA / RN License / 1-2 Yrs Exp | 2 – 3 Years (Post-MSN) | $115,000 – $145,000 | $300k – $450k | High (HRSA Grants, Employer Reimbursement, Loan Forgiveness) |
| Master of Public Health (MPH) | $45,000 – $85,000 | 3.0+ GPA / GRE Optional | 2 Years | $65,000 – $95,000 | $50k – $150k | Moderate (Fellowships, Federal Service Obligation Programs) |
Frequently Asked Questions
What is the average ROI for a master's degree in 2026?
The average 5-year net ROI for a US master's degree in 2026 ranges from $50,000 (MPH) to $650,000 (MS Computer Science). High-ROI programs like MS CS at flagship state schools cost $40k-$70k but yield median starting salaries of $125k+, while top-tier MBAs cost $200k+ but unlock $175k+ base salaries with significant signing bonuses.
How do I calculate if grad school is worth the debt?
Calculate Total Cost of Attendance (tuition, fees, living expenses, lost wages) versus the Net Present Value (NPV) of the incremental salary increase over 5-10 years. Use a discount rate of 5-7%. If the NPV of the salary delta exceeds total costs by 2x, the investment clears a standard hurdle rate. Factor in tax implications and loan interest (Grad PLUS ~8.05%).
Which graduate degrees have the highest salary-to-debt ratio in 2026?
MS in Computer Science (in-state public), MS in Nursing (NP/DNP), and MS in Electrical Engineering offer the highest salary-to-debt ratios, often exceeding 3:1. Graduates typically borrow $40k-$60k for starting salaries of $115k-$135k. Conversely, MFAs, MPHs, and lower-ranked Law degrees frequently fall below 1:1 ratios.
Does an online master's degree have the same ROI as on-campus?
Yes, for technical fields (CS, Data Science, Engineering), online degrees from accredited public universities (e.g., Georgia Tech OMSCS, UT Austin) deliver near-identical ROI. Costs are 50-70% lower ($10k-$30k total) while employer recognition remains high. For MBA/Networking-heavy degrees, on-campus ROI remains superior due to recruiting access and alumni networks.
What are the hidden costs of graduate school that ruin ROI calculations?
Hidden costs include: 1) Opportunity cost of lost wages ($60k-$150k/yr), 2) Health insurance premiums ($3k-$5k/yr if not covered), 3) Origination fees on Grad PLUS loans (4.228%), 4) Interest capitalization during deferment, 5) Relocation/high cost-of-living adjustments, and 6) Certification/licensure exam fees ($1k-$3k) required post-graduation.
Strategic Final Takeaway
When evaluating Graduate School ROI Calculator 2026 Funding Packages Versus Industry Salary Outcomes, base your decisions on accredited institutional standards, measurable return on investment (ROI), and up-to-date official guidelines. Always verify specific dates and requirements through official regulatory portals.