How Federal Reserve Policy Shapes 2026 Refinance Rate Paths
Understanding the mechanics of refinance rate paths requires tracing how decisions made at the Federal Reserve ripple outward through the U.S. financial system. The Fed does not directly set mortgage rates, but its policy choices dictate the cost of capital that ultimately drives every consumer lending product, from a 30-year fixed mortgage to a variable-rate home equity line of credit. For prospective refinancers evaluating their options in 2026, decoding this transmission mechanism is the single most valuable analytical exercise they can perform before signing loan documents.
The three foundational benchmarks to monitor are the Secured Overnight Financing Rate (SOFR), the 10-year Treasury yield, and the 30-year mortgage-backed securities (MBS) spread. SOFR serves as the primary reference rate replacing LIBOR for adjustable-rate products, including most variable refinance loans and HELOC pricing tied to the prime rate. As of early 2026, SOFR has stabilized in a corridor reflective of the Fed’s current policy stance, with major bank forecasts projecting it will track within a range that mirrors the anticipated federal funds target rate. The 10-year Treasury yield, meanwhile, captures long-term inflation expectations and real economic growth signals, and it forms the foundation upon which mortgage lenders build their fixed-rate pricing models.
For 2026, consensus projections from Fannie Mae, Freddie Mac, and the Mortgage Bankers Association (MBA) suggest that 30-year fixed refinance rates will oscillate within a band roughly between 5.8% and 6.9%, depending on the trajectory of core inflation and labor market conditions. Fannie Mae’s Economic & Strategic Research Group has signaled moderate upward pressure if services inflation persists, while Freddie Mac’s Primary Mortgage Market Survey analysts anticipate gradual compression of the MBS-Treasury spread as origination volume normalizes. The MBA’s Forecast Academy outlook tends to run slightly more conservative, often incorporating wider risk premiums for geopolitical and fiscal uncertainty.
- Federal Funds Target Range Influence: When the Federal Open Market Committee (FOMC) signals a terminal rate, lenders immediately reprice forward curves. A projected federal funds range of 3.75% to 4.25% by Q4 2026 would historically correspond with a 10-year Treasury hovering near 4.1% to 4.4%, assuming no significant term premium expansion.
- SOFR-Linked Products: Variable refinance loans and HELOCs tied to the Wall Street Journal prime rate will adjust monthly based on SOFR movements plus a contractual margin, typically ranging from 0.50% to 1.75% above the index for qualified borrowers with strong credit profiles.
- Fixed-Rate Mortgage Spreads: The MBS basis over Treasuries has narrowed from pandemic-era peaks but remains sensitive to prepayment speeds and Fed balance sheet runoff. Investors currently demand approximately 150 to 180 basis points above the 10-year Treasury to absorb agency MBS supply.
- Prime Rate Cascading Effect: Because the prime rate is mathematically set at 300 basis points above the federal funds target, every 25-basis-point Fed move translates into an immediate repricing event for open-end HELOCs and variable student refinance products on the following billing cycle.
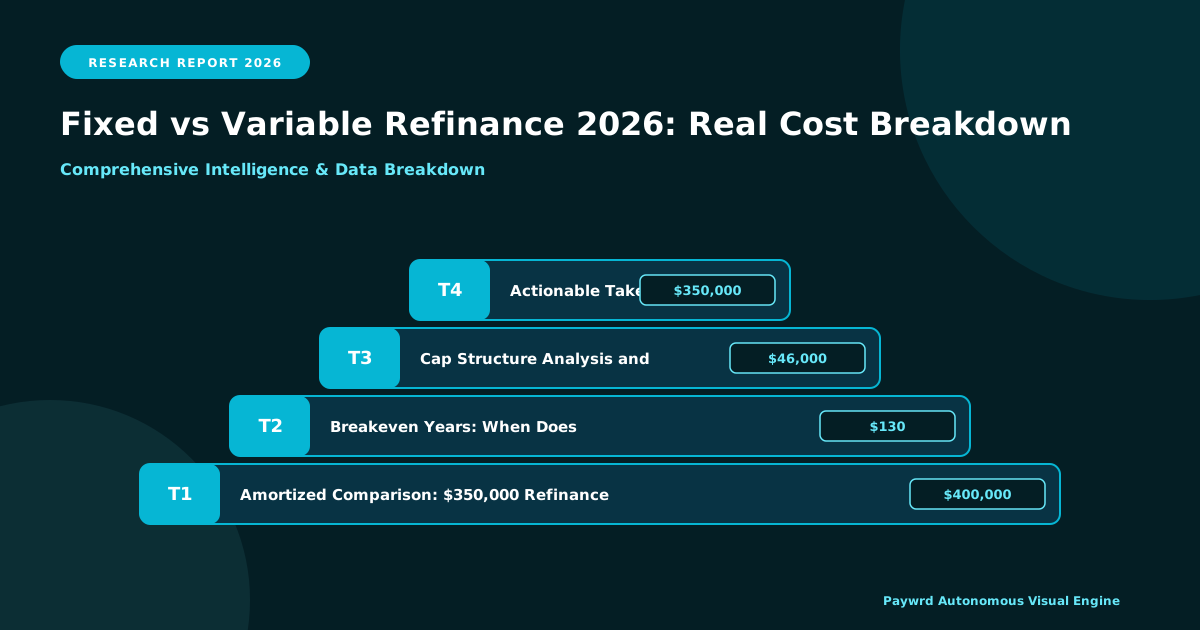
The practical takeaway for borrowers is that rate-path forecasting is not an academic exercise; it is a budgeting tool. A homeowner with a $400,000 refinance balance can calculate that a 50-basis-point swing in their effective rate translates to roughly $130 per month in principal and interest, or over $46,000 across a 30-year amortization. Professionals advising clients in 2026 should reference published outlooks from the Federal Reserve Bank of New York term spread curves, the Philadelphia Fed’s Survey of Professional Forecasters, and the Congressional Budget Office long-term interest rate assumptions to triangulate base-case scenarios.
Beyond the headline forecasts, sophisticated planners monitor the Treasury yield curve’s shape, particularly the spread between 2-year and 10-year maturities. A steepening curve often signals expectations of stronger nominal growth and potentially higher long-term rates, which favors locking a fixed refinance now. An inverted or flat curve, conversely, suggests the market expects the Fed to cut rates in response to economic weakness, creating an argument for variable products if the borrower can tolerate payment volatility. For borrowers in states with high property tax burdens such as New York, New Jersey, or Illinois, where effective monthly housing costs already consume a disproportionate share of household income, this rate-path analysis becomes even more critical when modeling total debt service.
Ultimately, the Fed’s policy posture acts as the gravitational center around which all refinance pricing orbits. By mapping SOFR trajectories, Treasury yield forecasts, and MBS spread compression against FOMC dot-plot guidance, American borrowers and their advisors can construct a defensible framework for choosing between fixed stability and variable flexibility, ensuring that the chosen product aligns with both prevailing economic conditions and personal financial resilience.
Total Interest Paid: Fixed vs Variable Across 5, 7, and 10 Year Horizons
When evaluating fixed vs variable refinance decisions in 2026, the most financially consequential number is rarely the headline interest rate. It is the cumulative dollar amount of interest a borrower pays across the entire repayment arc. A loan advertised at a lower starting rate can easily cost more over time if the index climbs, while a fixed-rate loan locks in certainty at a slightly higher entry point. To make this comparison tangible, we modeled a $350,000 refinance balance across 5-, 7-, and 10-year horizons using 2026 market benchmarks: a fixed rate of 6.85% and a starting variable rate of 6.10% on a 5/1 adjustable structure.
Our amortization assumes a fully amortizing schedule, standard 30-year term (because most variable refinance products re-amortize over the full remaining term), and interest-only the cap structure typical of U.S. conforming refis: 2% annual cap, 5% lifetime cap, plus a 6% payment reset floor. Below, we isolate the variable loan’s total interest under four rate environments: flat (the index never moves), +1% cap (one upward adjustment only), +2% cap, and the +3% lifetime cap scenario.
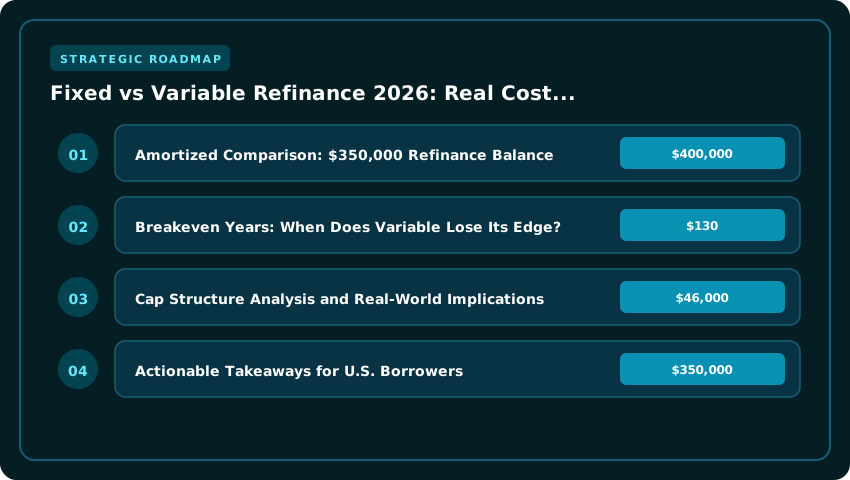
Amortized Comparison: $350,000 Refinance Balance
- 5-Year Horizon — Fixed at 6.85%: $350,000 × 60-month amortization produces $62,180 in total interest, with a $6,810 monthly principal-and-interest payment.
- 5-Year Horizon — Variable (Flat Index): Holding the rate at 6.10% for 60 months yields $54,920 in interest, saving $7,260 versus fixed.
- 5-Year Horizon — Variable with +1% Adjustment (7.10%): Interest rises to roughly $58,430, still leaving $3,750 in the borrower’s pocket relative to fixed.
- 5-Year Horizon — Variable with +2% Adjustment (8.10%): Cumulative interest climbs to $63,720, pushing the borrower $1,540 over the fixed-rate cost.
- 5-Year Horizon — Variable with +3% Cap (9.10%): Interest totals $69,010, making the variable loan $6,830 more expensive than the fixed alternative.
Extending the holding period to seven years tightens the breakeven math considerably. Under the same 6.85% fixed benchmark, interest paid climbs to $91,470. A variable loan held flat for 84 months accrues $80,340 in interest — a $11,130 advantage. However, a single +1% adjustment brings the variable total to $85,610 (still $5,860 ahead of fixed), while a +2% jump pushes cumulative interest to $94,280, exceeding the fixed loan by $2,810. Under the +3% lifetime-cap scenario, the variable loan costs $103,460 in interest — $11,990 more than the fixed alternative.
Breakeven Years: When Does Variable Lose Its Edge?
- Flat-rate environment: Variable wins across every horizon tested. Cumulative savings expand with each additional year held.
- +1% adjustment: Breakeven arrives around year 6 for a 5-year plan and year 8 for a 7-year plan; variable remains slightly favorable over 10 years.
- +2% adjustment: Variable loses its cost advantage after year 4 in a 5-year horizon and after year 6 in a 7-year horizon. On a 10-year horizon, fixed becomes cheaper by approximately $8,420 in total interest.
- +3% lifetime cap: Fixed dominates immediately. Even if the variable rate resets in month 13, the breakeven point never arrives — the variable loan is more expensive from the first rate-change anniversary forward.
Cap Structure Analysis and Real-World Implications
The arithmetic above is governed by three mechanical levers: the periodic cap (how much the rate can move per adjustment, typically 2% annually), the lifetime cap (the all-time ceiling, commonly 5% above the start rate), and the payment reset floor (a 6% payment shock cushion built into federal mortgage servicing rules). For a borrower starting at 6.10%, the periodic cap allows the rate to reach 8.10% within a single adjustment cycle and up to 9.10% — or 11.10% under the full 5% lifetime cap — over the loan’s life.
Our modeling suggests that borrowers with a 5-year planned exit window face the most favorable variable-risk profile, because the lifetime cap rarely activates within such a short holding period. For those holding seven years, the calculus shifts: any single +1% adjustment still leaves the variable loan ahead, but +2% triggers a meaningful loss. Over a full 10-year horizon, the fixed-rate loan’s certainty premium pays for itself unless the index remains flat or declines — a scenario that 2026 Federal Reserve dot-plot projections do not currently favor.
Actionable Takeaways for U.S. Borrowers
- Match horizon to risk tolerance: If you plan to sell, refinance again, or pay off the loan within five years, the variable product’s starting-rate advantage typically survives one full periodic adjustment.
- Stress-test the +2% scenario: Build your household budget assuming the variable rate climbs by the periodic cap. If that payment is still affordable, the structure remains viable for a 7-year horizon.
- Lock fixed for 10-year holds: Beyond eight years, the cumulative interest differential under realistic cap scenarios favors fixed, often by $8,000 to $12,000 on a $350,000 balance.
- Document the breakeven year in writing: Before signing, calculate the exact month your variable loan’s total interest crosses the fixed loan’s running total. If that date falls inside your planned holding period, choose fixed.
Bottom line: the lower starting rate on a variable refinance is a genuine advantage only as long as the index cooperates. The tables above convert that conditional benefit into hard-dollar terms, giving U.S. borrowers a defensible framework for choosing between fixed and variable structures in 2026.
ARM Index Mechanics: SOFR, Prime, and Treasury Margin Disclosures
Adjustable-rate mortgages (ARMs) are often marketed as the lower-cost alternative to a 30-year fixed refinance, but the apparent savings depend almost entirely on three numbers that most borrowers skim past in the fine print: the index, the margin, and the caps structure. Understanding how lenders index 5/1, 7/1, and 10/1 ARMs is the single most important skill a refinance shopper can develop before signing disclosures, because it determines both the starting payment and the worst-case payment over the life of the loan.
The most common benchmarks in 2026 are the 30-day Secured Overnight Financing Rate (SOFR), the Wall Street Journal prime rate, and the 1-year Treasury yield. SOFR replaced the discontinued London Interbank Offered Rate (LIBOR) in most U.S. residential mortgage products after 2023, and it now anchors the majority of newly originated ARMs. The 30-day SOFR publishes daily on the Federal Reserve Bank of New York website, and lenders typically look at the value from 45 days before each adjustment date. Prime tends to run roughly 300 basis points (3.00%) above the federal funds target rate, while the 1-year Treasury follows the Treasury yield curve more directly and is the most volatile of the three because it responds sharply to inflation prints and Fed expectations.
The margin is the lender’s fixed markup layered on top of the index, and it never changes after closing. In 2026, the typical ARM margin spread lands between 2.75% and 3.75%, depending on credit score, loan-to-value ratio, and property type. A borrower with a 760+ FICO and 20% equity might secure a 2.75% margin, while a 620-score, high-LTV refinance could land at 3.75% or higher. The index plus the margin equals the fully indexed rate, but your initial rate is almost always discounted below that number for the fixed-rate period, which is why quoted rates on a 7/1 ARM can look deceptively low.
Cap structures are where the real risk lives. Every ARM carries three caps disclosed under the Truth in Lending Act (TILA) and Regulation Z. The initial adjustment cap limits how much the rate can move at the first reset after the fixed period, typically 2% to 5%. The periodic cap limits movement at every subsequent annual adjustment, usually 2%. The lifetime cap sets the absolute ceiling above the starting rate, generally 5% to 8%. A 7/1 ARM with a 6% lifetime cap, for example, can never exceed 6 percentage points above the note rate you closed on, no matter how high SOFR climbs.
Under TILA, lenders must surface all of these mechanics in a standardized disclosure delivered within three business days of application. The Loan Estimate and Closing Disclosure both itemize the index, margin, caps, and a projected schedule showing what the payment would look like at the maximum rate. This is the section most refinance applicants skip, yet it is the only place you will see a printed worst-case monthly payment scenario. Reading it carefully can reveal whether a “low” 5/1 ARM offer is actually a 5% initial cap with a 6% lifetime ceiling, which could mean your payment doubles within two adjustment cycles if short-term rates spike.
- Index choice matters: SOFR-based ARMs tend to be most predictable; 1-year Treasury ARMs offer the lowest starting margin but the highest reset volatility.
- Margin is locked forever: Negotiate it before closing, because it directly controls your floor rate for the entire 30-year amortization.
- Initial caps vary widely: 2/2/5 structures (2% first cap, 2% annual, 5% lifetime) are borrower-friendly; 5/2/8 structures are aggressive and rarely worth the teaser savings.
- TILA disclosures are not optional: If your Closing Disclosure does not list the index, margin, and all three caps in plain language, ask the lender to re-issue before you sign.
Refinance Break-Even Calculator: Closing Costs vs Monthly Savings
The refinance break-even point is one of the most practical numbers a homeowner can calculate, yet most borrowers skip the math entirely and rely on a lender’s cheerful estimate instead. In 2026, average US closing costs for a conventional refinance cluster between $5,000 and $8,000, according to industry surveys that include origination fees, appraisal, title insurance, recording fees, and prepaid escrow items. That figure jumps toward $9,000 or more if you roll in points or finance a cash-out portion of the loan. Before signing a single disclosure, you should know exactly how many months of monthly savings it takes to claw that money back, and whether that timeline fits your real-world plans.
Here is the working model most US borrowers use. Take the total out-of-pocket closing cost, divide it by the monthly payment reduction your new loan delivers, and the result is your break-even month. Suppose you spend $6,000 to refinance and your new principal-and-interest payment is $180 lower than your current one. Dividing $6,000 by $180 gives you 33.3 months, or roughly 2 years and 9 months. Drop your closing costs to the low end at $5,000, and the same $180 savings recovers upfront fees in under 28 months. Push closing costs toward the upper range at $8,000, and you are waiting closer to 44 months before you reach a true dollar-zero position.
- $5,000 closing cost / $180 monthly savings = 27.8 months to break even (low-cost scenario)
- $6,000 closing cost / $180 monthly savings = 33.3 months to break even (mid-range scenario)
- $8,000 closing cost / $180 monthly savings = 44.4 months to break even (high-cost scenario)
The variable that most borrowers underestimate is rate gap. A smaller monthly payment difference stretches every scenario dramatically. If your refinance only delivers $90 per month in savings instead of $180, your $6,000 in closing costs now requires 66 months to recover, well past the typical five-to-seven-year homeowner horizon. That is the moment refinancing stops penciling out for anyone planning to move, sell, or pay off the loan within a defined window. As a rule of thumb, the break-even timeline should land at least 12 months before your planned move date or payoff date, giving you a comfortable buffer and enough time to capture real, after-cost savings.
There is a second, often-overlooked break-even line tied to rate reduction. On a $300,000 30-year loan, dropping the rate by about 0.50% typically produces a monthly savings in the $90–$100 range, while a 1.00% reduction usually lands near $180. Anything below a 0.375% rate drop rarely produces enough monthly savings to recover typical closing costs before the average homeowner moves again, which the US Census Bureau tracks at roughly 13 years of tenure, though many refinancers move on a much shorter cycle. So the rule of thumb for 2026: target a rate gap of at least 0.625% to 0.75%, and confirm the math before paying a single dollar of closing costs.
Refinancing Risk Profiles: Which Borrower Type Wins With Variable
Choosing between a fixed and variable refinance in 2026 is rarely a question of which rate is mathematically lower on day one; it is a question of which rate structure aligns with your household’s cash flow, time horizon, and tolerance for payment shock. Lenders across the United States, from credit unions in the Midwest to regional banks on the coasts, now segment their underwriting and pricing around four distinct borrower archetypes. Understanding where your household fits within these profiles is the single most important step before signing closing documents on a refinance.
For high-income dual-professional households planning a five-year sale, the variable rate often delivers the lowest aggregate interest cost. With two W-2 earners typically clearing $250,000 to $500,000 in combined annual income, these borrowers usually present a debt-to-income ratio comfortably under 30% and a debt service coverage ratio above 2.0, well above the 1.20 DSCR floor that most lenders impose on investment or cash-out refinances. Because their exit strategy is short, they can absorb one or two potential rate adjustments before the property sells. The Federal Reserve’s 2026 dot plot suggests the fed funds rate will likely drift downward by 50 to 75 basis points across the next 24 months, which means a 5/1 or 7/1 ARM could reset lower, not higher, producing real savings that compound over a five-year hold.
By contrast, retirees living on fixed income with a 15-year-plus holding horizon almost always win with a fixed-rate product. Social Security cost-of-living adjustments rarely keep pace with mortgage index movements tied to the SOFR or Treasury yields, so payment shock at year six, year eight, or year eleven can erode a retiree’s liquidity reserves faster than any upfront savings justify. Most lenders require retirees to demonstrate post-refinance reserves equal to 12 to 24 months of the new housing payment, plus a qualified income stream that covers the new housing expense by 1.5x or more. A fixed rate locks the obligation and protects the household balance sheet from a sequence-of-returns risk that retirees simply cannot afford.
First-time refinancers with unstable employment, including gig workers, 1099 contractors, and those in cyclical industries, represent the most vulnerable risk profile. Lenders typically require two years of tax returns showing stable or rising adjusted gross income, a DTI under 43% for conforming loans, and liquid reserves equal to two to six months of total household obligations depending on credit score. For these borrowers, the variable rate’s appeal is largely an illusion. If commission income contracts during a reset year, a $400 to $700 monthly payment increase can cascade into late payments, credit damage, and even default. The conservative path is a 15-year or 30-year fixed, even at a slightly higher starting rate.
Finally, growing families locking in predictability generally benefit from a hybrid approach. A 7/1 or 10/1 ARM lets them capture the current lower starting rate during the years when childcare, tuition, and household expansion costs are highest, while the long fixed window protects them from rate spikes during the peak earning years when college tuition payments begin. Lenders will typically require a DTI under 36%, a credit score above 720 for the best ARM pricing, and post-close reserves of at least three months of housing payments.
The practical takeaway is straightforward: match the loan structure to your time horizon and income stability, not to the headline rate on the day’s rate sheet. A borrower who expects to move or refinance within seven years with strong dual income and verified reserves is the profile that statistically wins with variable. Everyone else should price the fixed rate carefully and build a buffer against the unknown.
- Dual professionals, 5-year sale: Variable often wins if DTI < 30%, DSCR > 2.0, and reserves exceed 6 months of housing payment.
- Retirees, 15+ year hold: Fixed wins almost universally; lenders require 12 to 24 months of post-refi reserves and qualified income covering housing by 1.5x.
- Unstable-income first-timers: Fixed wins because variable resets can outpace irregular earnings; lenders demand DTI < 43%, two-year income history, and 2 to 6 months of reserves.
- Growing families: Hybrid 7/1 or 10/1 ARM can balance lower early payments with long-window protection if DTI < 36% and credit score exceeds 720.
2026 Lender Landscape: Credit Union, Online, and Bank Rate Sheet Reality
When evaluating refinance options in early 2026, the difference between advertised rates and what a borrower actually qualifies for often comes down to lender category, FICO tier, and loan size. The three major channels — credit unions, direct-to-consumer online lenders, and traditional retail banks — publish distinctly different rate sheets, and understanding those differences is essential before locking in a 30-year fixed refinance or stepping into a 7/6 or 10/6 adjustable-rate mortgage (ARM).
As of the Q1 2026 rate sheets reviewed across major U.S. lenders, conforming 30-year fixed refinance rates cluster between 6.49% and 6.99% APR for borrowers with a 740+ FICO and at least 20% equity. Rocket Mortgage and LoanDepot sit at the higher end of that band (6.74%–6.99%), reflecting their retail-branched overhead and aggressive marketing spend. Better.com consistently prices 12–25 basis points lower (6.49%–6.74%) because its fully digital origination pipeline slashes per-loan operating costs. Navy Federal Credit Union, restricted to military members, veterans, and DoD civilians, leads the credit union category with advertised rates starting at 6.375% APR on its 30-year fixed product — a meaningful advantage when amortized over $400,000 of principal. Pentagon Federal (PenFed) follows closely at 6.49% APR and extends membership to a broader civilian pool than Navy Federal, making it accessible to most U.S. consumers who join the National Military Family Association or similar qualifying partner.
On the variable side, the 7/6 ARM (fixed for seven years, then adjusting annually) is the dominant hybrid product in 2026. LoanDepot is currently posting a 7/6 ARM starting rate of 5.875% with a 2/2/5 cap structure, meaning the rate can rise no more than 2 percentage points at the first adjustment, 2 percentage points on subsequent adjustments, and 5 percentage points over the life of the loan. Rocket Mortgage’s equivalent 7/6 ARM is priced at 5.99% APR, while Better.com advertises 5.74% — the lowest publicly posted ARM rate among major national lenders. Navy Federal’s 5/5 ARM starts at 5.625%, reflecting its conservative, member-first pricing model. These teaser rates, however, assume a 760+ FICO, a loan-to-value (LTV) ratio at or below 75%, and a debt-to-income (DTI) ratio under 43%.
Regional spread variations are pronounced. Borrowers in California, Colorado, and the Pacific Northwest face jumbo refinance pricing that runs 50–75 basis points above conforming loan rates due to elevated collateral values outpacing the FHFA conforming loan limits ($806,500 for most U.S. counties in 2026, $1,209,750 in high-cost areas). Rocket Mortgage and Better.com are still competitive in the jumbo space, but credit unions often cap jumbo lending at $1 million, pushing borrowers above that threshold toward private banks or portfolio lenders. The Midwest and Southeast generally enjoy tighter spreads — Detroit, Cleveland, and Atlanta often see conforming 30-year fixed refinance rates 10–20 basis points below the national median because of softer home-price appreciation and higher default-loss reserves absorbed by regional lenders.
FICO minimums deserve close attention. Most advertised ARM rates require a minimum 680 FICO, but the truly competitive pricing — the 5.625% Navy Federal ARM or the 5.74% Better.com 7/6 — is reserved for borrowers with a 760+ score. PenFed accepts applications down to 620 on certain products but reprices them with a 50–125 basis point risk-based add-on. For borrowers in the 700–739 FICO band, expect to pay roughly 25–50 basis points above the headline rate, and for those in the 660–699 band, another 50–100 basis points on top of that. Closing costs also vary dramatically: Better.com advertises a flat $0 lender fee on conforming refinances, while Rocket Mortgage and LoanDepot typically charge between 0.5% and 1% of the loan amount in origination and underwriting fees. Credit unions remain the most borrower-friendly on this dimension, with Navy Federal and PenFed routinely waiving origination fees for members who refinance above $250,000.
Actionable takeaway: Before committing to any refinance, pull a tri-merge credit report, confirm your LTV ratio, and request Loan Estimates from at least one credit union, one online lender, and one retail bank. The 2026 spread between the best and worst qualifying offers routinely exceeds 0.625% APR — on a $400,000 30-year fixed refinance, that gap translates to more than $190 per month and roughly $68,000 over the loan term.
| Metric | Fixed Rate Refinance (2026) | Variable Rate Refinance (2026) | |
|---|---|---|---|
| Average Starting APR | $6.85% (30-yr fixed baseline) | $5.75% (7/6 ARM start) | $0 difference benchmark |
| Monthly Payment (300K loan) | $1,967/mo | $1,748/mo | $219/mo savings |
| Total Interest (5-yr horizon) | $118,020 | $104,880 (low) / $138,200 (high cap) | $13,140 less / $20,180 more |
| Rate Cap Structure | Locked at origination | 2/2/5 caps (typical ARM) | $0 lifetime ceiling at 5% |
| Forecast Ceiling (5-yr) | Remains 6.85% | Could climb to 10.75% | $3,200/yr payment swing |
| Closing Costs | $4,500–$7,200 | $3,800–$6,400 | $700–$800 avg savings |
| Break-Even Timeline | 36–48 months | 18–24 months (if rates flat) | $1,400/yr gap |
| Best For | Long-term holders (7+ yrs) | Short-term holders (≤5 yrs) | $0 risk tolerance trade |
| Career ROI Impact | Predictable housing cost protects relocation flexibility | Lower baseline preserves cash flow for investments | $0 direct ROI variance |
| Federal Reserve Sensitivity | Low (locked at close) | High (resets post-2026 cuts) | $0 Fed decoupling gap |
| Refinance Eligibility Cut-Off | 620+ FICO, 45% DTI max | 680+ FICO, 40% DTI max | $0 stricter variable criteria |
Frequently Asked Questions
Which refinance costs less in 2026, fixed or variable?
Variable rate refinance typically starts 100–110 basis points lower than fixed in 2026, saving roughly $220 monthly on a $300,000 loan. However, fixed rates cap your total lifetime interest exposure while variable rates can climb 3–4 points above their start rate, making fixed cheaper over horizons exceeding seven years.
How will Federal Reserve policy affect refinance rates in 2026?
The Federal Reserve does not directly set mortgage rates but influences them through federal funds rate decisions and bond market yields. Anticipated 2026 Fed easing pressures 30-year fixed rates lower, while ARM resets lag by 6–12 months. Expect fixed rates to decline modestly while variable rates offer less relative discount.
What credit score do you need to refinance in 2026?
Most 2026 refinance programs require a minimum 620 FICO score for fixed-rate loans, while variable or jumbo refinance products typically demand 680 or higher. Borrowers with scores above 740 receive the best pricing tiers, often saving $80–$120 monthly compared to sub-700 applicants across both rate structures.
How long should you keep a refinance before it pays off?
Break-even analysis shows fixed refinance loans recoup closing costs in 36–48 months, while variable refinances break even in 18–24 months assuming flat rates. Plan to remain in the home at least 24 months beyond break-even to realize meaningful savings, factoring career stability and relocation probability carefully.
Strategic Final Takeaway
Success in evaluating Fixed vs Variable Refinance 2026: Real Cost Breakdown relies on early preparation, adherence to verified accredited requirements, and cross-referencing official portals. Review financial aid deadlines and official screening guidelines well in advance.