
The 2026 Landscape of Career-Connected Learning in American High Schools
Walk into a high school in Columbus, Ohio, or Katy, Texas, or Long Beach, California, and you will notice something that would have looked foreign a decade ago. Sophomores in lab coats are calibrating robotic arms. Seniors are earning stackable credentials in solidworks before they have even submitted a college application. Counselors are scheduling students into work-based learning rotations the way they once scheduled them into homeroom. This is the new face of American secondary education, and the data tells a compelling story about how districts nationwide are reinventing the high school experience around career-connected learning.
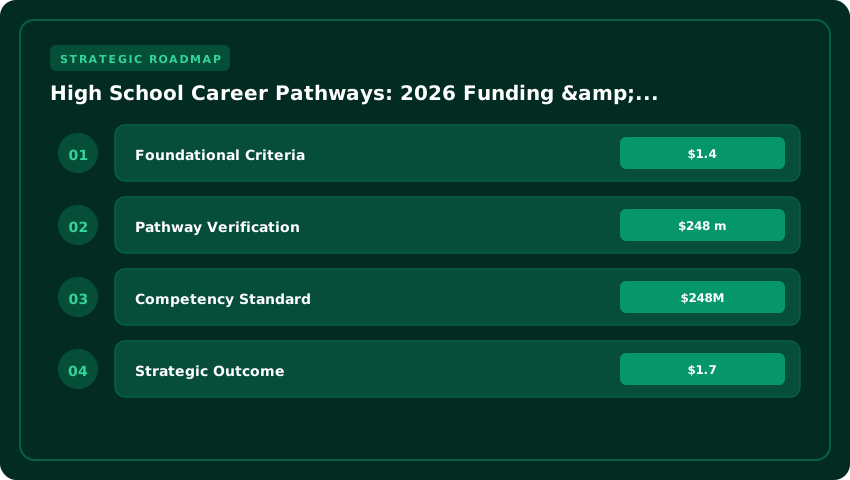
According to the National Center for Education Statistics, approximately 8.3 million high school students participate in Career and Technical Education (CTE) programs nationally, representing roughly 73% of all public high school enrollment. That figure has climbed steadily since the Perkins V reauthorization of 2018, which unleashed over $1.4 billion in annual federal CTE funding and empowered states to design more flexible, locally responsive programming. In 2026, that federal investment continues to anchor a funding ecosystem that includes state matching dollars, local levy support, and an expanding pool of industry co-investment through workforce development boards.
The terminology itself has shifted. Districts are no longer simply offering “CTE electives.” They are building career pathways, structured sequences of coursework, dual enrollment, industry credentials, and work-based learning that align with regional workforce priorities. In Ohio, the Department of Education and Workforce now recognizes more than 50 state-approved career pathways spanning advanced manufacturing, healthcare, information technology, and agribusiness. Texas has scaled its Programs of Study framework across more than 1,200 districts, with the Texas Education Agency reporting that pathway concentrators graduate at rates exceeding 96%. California’s Strong Workforce Program, backed by a recurring allocation of roughly $248 million annually, has funded more than 700 regional projects since 2018, many targeting emerging sectors like clean energy, biotechnology, and logistics.

The shift reflects an uncomfortable economic reality: American employers cannot fill skilled trades and middle-skill positions fast enough. The U.S. Bureau of Labor Statistics projects that roughly 7 million job openings will require some form of postsecondary credential by 2030, yet only about 40% of workers currently hold a credential beyond a high school diploma. High schools have responded by aggressively aligning curricula with industry demand. Aerospace and aviation pathways have proliferated near Boeing and Lockheed Martin corridors in Washington State and Texas. Robotics and mechatronics programs are expanding in Indiana and Michigan, often co-developed with community colleges and union apprenticeship sponsors. Advanced manufacturing pathways, supported by credentials from the National Institute for Metalworking Skills (NIMS) and the Manufacturing Skill Standards Council (MSSC), now exist in nearly every state.
Work-based learning has emerged as the connective tissue. The National Governors Association reports that participation in structured internships, apprenticeships, and youth apprenticeships has grown by more than 35% since 2020, with states like North Carolina, South Carolina, and Wisconsin expanding youth apprenticeship frameworks that allow students to earn wages and academic credit simultaneously. Registered apprenticeship programs for high schoolers, once rare, now exist in more than 500 school districts nationwide, according to the U.S. Department of Labor.
- Enrollment signal: Approximately 8.3 million high schoolers participate in CTE nationally, with pathway concentrators graduating at significantly higher rates than peers.
- Federal investment: Perkins V continues to channel over $1.4 billion annually into state CTE systems through 2026.
- State scale: Ohio (50+ pathways), Texas (1,200+ districts), and California ($248M Strong Workforce Program) exemplify the scaling playbook.
- Work-based learning growth: Internship and apprenticeship participation has surged more than 35% since 2020.
- Economic driver: Roughly 7 million middle-skill job openings by 2030 are forcing districts to rethink the purpose of the high school diploma.
For families evaluating their options, the takeaway is clear: career-connected learning is no longer a niche track for non-college-bound students. It is the dominant redesign strategy shaping how public high schools prepare young people for a credential-driven economy. Understanding the funding mechanics and accreditation frameworks behind these pathways, which we explore in the sections ahead, is now essential for any student planning their next two to four years.
Federal and State Funding Mechanisms: Perkins V, ESSA, and Beyond
Funding a robust high school career pathway rarely depends on a single budget line. In 2026, the most resilient programs blend federal allocations, state-level grants, and local district investments into a layered financial strategy that can withstand shifting political winds. Understanding how these streams connect—and where the gaps remain—is essential for educators, administrators, and policymakers who want to build sustainable Career and Technical Education (CTE) pipelines that prepare students for both postsecondary credentials and immediate workforce entry.
The cornerstone of federal CTE funding remains the Carl D. Perkins Career and Technical Education Act of 2018 (Perkins V), a reauthorization that emphasized equity, industry-recognized credentialing, and stronger alignment between secondary and postsecondary education. For fiscal year 2026, Congress has allocated approximately $1.4 billion in basic state grants under Title I of the legislation, a figure consistent with the program’s funding trajectory over the past several budget cycles. While modest in the broader context of the $1.7 trillion federal education portfolio, Perkins dollars are uniquely flexible: districts may use them for equipment modernization, work-based learning coordinators, teacher training, and dual enrollment partnerships with community colleges.
States receive their Perkins V allocations through a formula that considers population, poverty levels, and the number of secondary and postsecondary CTE concentrators. Once funds reach the state, at least 85 percent must be sub-granted to local eligible recipients through a competitive or formula-based process, while up to 10 percent supports leadership activities and the remainder funds administration. The average per-student Perkins allocation in 2026 hovers around $150 to $165 nationwide, though significant variation exists. Wealthier states with larger CTE enrollments—such as Texas, California, and Florida—often see higher per-pupil figures, while rural districts in lower-population states may receive proportionally less. For high-poverty districts serving historically marginalized students, the law’s reserve requirement of 7 percent for special populations remains a critical equity safeguard, ensuring that funds reach learners who need them most.
Beyond Perkins, the Every Student Succeeds Act (ESSA) continues to play a complementary role through Title IV-A, the Student Support and Academic Enrichment program. Although Title IV-A was effectively block-granted into state formula allocations in 2020, districts still have flexibility to direct approximately $1,250 per student toward activities aligned with a well-rounded education, safe and healthy schools, and the effective use of technology. CTE programs frequently tap Title IV-A dollars to fund career counseling software, work-based learning transportation stipends, and industry-aligned curriculum development. When combined with Perkins V base funding, Title IV-A can effectively double a district’s per-student investment in career-connected learning.
The U.S. Department of Labor has also emerged as a meaningful partner, particularly through Registered Apprenticeship grants and Youth Apprenticeship READY Act funding. In 2026, the Department is projected to disburse over $240 million in apprenticeship expansion grants, with a significant portion reserved for pre-apprenticeship programs that begin as early as ninth grade. These grants often require a 50 percent local match, which encourages sustainable public-private partnerships between school districts, workforce development boards, and employer sponsors. For high school students, this means access to earn-while-you-learn opportunities that lead directly to industry credentials in fields like advanced manufacturing, healthcare, and information technology.
State-level initiatives frequently amplify federal dollars. In Texas, House Bill 5 (2013) restructured high school graduation requirements around endorsement pathways, including Career and Technical Education, and continues to drive funding toward programs of study aligned with high-demand industries. Texas Education Agency CTE allocations now exceed $1.1 billion statewide when federal, state, and local funds are combined. In California, the K-12 Strong Workforce Program, administered by the California Community Colleges Chancellor’s Office, provides $300 million annually to create, support, and improve CTE pathways at the secondary level. California also recently expanded the Golden State Pathways Program, adding another $150 million for 2026 to incentivize college and career pathway development in local education agencies.
The Columbus City Schools district in Ohio offers a compelling case study in stacking funding layers effectively. With more than 50,000 students across Ohio’s largest urban district, Columbus has built a portfolio that draws on Perkins V base funding, Ohio’s state CTE guarantee, ESSA Title IV-A dollars, and targeted apprenticeship grants from the Department of Labor. The district’s career academies at schools like Columbus Alternative Academy and Walnut Ridge High School offer industry-aligned pathways in health sciences, information technology, and skilled trades, supported by an annual per-student investment that exceeds $600 when all funding sources are aggregated. This layered approach has allowed Columbus to sustain work-based learning coordinators, modern equipment purchases, and dual enrollment tuition waivers, demonstrating how strategic alignment across funding streams can transform a single-source grant into a comprehensive career pathway ecosystem.
Looking ahead, the proposed fiscal year 2026 federal budget includes a modest increase in CTE funding, with an additional $75 million allocated for Perkins V state grants and renewed emphasis on non-traditional fields such as clean energy, cybersecurity, and biotechnology. Advocacy groups are also pushing for the passage of the Career and Technical Education for the 21st Century Act, which would significantly expand eligibility for work-based learning expenses and create a dedicated federal matching program for state apprenticeship investments. While the legislative outlook remains uncertain, the trajectory is clear: career-connected learning is no longer a peripheral educational strategy. It is a central pillar of American workforce policy, and the funding mechanisms supporting it are growing in both scale and sophistication.
- Perkins V: $1.4 billion in federal allocations; $150–$165 average per student; 85 percent passed to local recipients.
- ESSA Title IV-A: Up to $1,250 per student in flexible funding, frequently leveraged for CTE support.
- DOL Apprenticeship Grants: Projected $240 million in 2026; requires 50 percent local match.
- State Initiatives: Texas CTE allocations exceed $1.1 billion; California K-12 Strong Workforce Program provides $300 million annually.
- Columbus City Schools Model: Combines Perkins V, state CTE guarantee, ESSA Title IV-A, and DOL grants; per-student investment exceeds $600.
Accreditation and Credit-Transfer Pathways: College Board, Dual Enrollment, and Industry Certifications
The true value of a high school career pathway hinges on a robust accreditation and credit-transfer ecosystem. When students, parents, and employers see that a program meets rigorous academic and industry standards, the pathway transforms from a simple elective into a launchpad for higher education and high-wage careers. In 2026, the integration of traditional academic accreditation with workforce readiness is more seamless than ever, ensuring that students are fully prepared to navigate the modern economy.
The College Board continues to play a pivotal role by aligning Advanced Placement (AP) courses with career-connected learning. For example, AP Computer Science Principles not only earns students valuable college credit at thousands of US universities but also prepares them for immediate industry challenges. This alignment ensures that students are not forced to choose between college preparation and career readiness; they can seamlessly pursue both while building a competitive academic transcript.
Dual enrollment agreements represent another critical pillar, allowing high schoolers to earn transcripted college credit while still in their hometown classrooms. Community colleges across the United States are pioneering innovative models where students earn both academic credit and a paycheck. Imagine a high school junior enrolled in an advanced manufacturing pathway who participates in a $15/hour paid internship while simultaneously earning community college credit. This model, often supported by state funding and local industry partnerships, drastically reduces future reliance on FAFSA and student loans, accelerating degree completion and immediate economic mobility.
Industry-recognized certifications provide the ultimate proof of skill competency, and high school programs are increasingly embedding these credentials directly into their curricula:
- CompTIA: A+ and Security+ certifications validate IT and cybersecurity skills, making graduates highly employable right out of high school.
- AWS (Amazon Web Services): Cloud practitioner certifications prepare students for the booming tech economy, aligning perfectly with university computer science programs.
- NIMS (National Institute for Metalworking Skills): Credentials that certify precision manufacturing skills, ensuring alignment with high-demand advanced manufacturing jobs.
Furthermore, university-level accreditation bodies are extending their influence into high school pathways. ABET accreditation principles, which govern college engineering and technology programs, increasingly inform high school STEM curricula, ensuring that foundational math and science courses meet rigorous collegiate expectations. Similarly, AACSB-aligned business programs at US universities are partnering with high schools to ensure that entrepreneurship and accounting courses seamlessly transfer into undergraduate business schools, preserving the academic value of early career exploration.
Behind the scenes, state education agencies (SEAs) serve as the essential gatekeepers of quality. SEAs are responsible for certifying CTE (Career and Technical Education) instructors, ensuring they possess both pedagogical skills and verifiable, real-world industry experience. They also rigorously review and approve program standards, ensuring that local school districts meet both federal guidelines and state workforce demands. By understanding this interconnected accreditation ecosystem, families can confidently navigate the 2026 landscape, selecting programs that offer genuine academic value and a direct line to long-term career success.
Building Industry Partnerships: From Makerspaces to Paid Internships
Sustainable career pathways do not materialize inside a vacuum; they require deliberate, structured relationships between school districts and the regional employers who will eventually hire graduating students. The most resilient programs in 2026 function less like traditional classrooms and more like collaborative ecosystems, where district administrators, local chambers of commerce, community college presidents, and workforce development boards share governance over curriculum design. When these partnerships are architected thoughtfully, students transition from theoretical learning to applied mastery with seamless continuity.
Consider the widely cited Jefferson High model, where engineering students present functional prototypes to a panel of aerospace engineers from regional suppliers. That demonstration day is not a culminating field trip; it is the capstone of a four-year advisory board relationship. Jefferson’s program director meets quarterly with a rotating council that includes manufacturing plant managers, a Boeing supplier quality representative, a union apprenticeship coordinator, and the dean of workforce development at the local community college. The advisory board reviews equipment purchases, validates that curriculum competencies mirror industry certifications, and identifies which sophomore and junior students should be nominated for paid summer placements.
The work-based learning sequence at Jefferson follows a deliberate scaffolding: freshmen explore career clusters in a semester-long foundations course; sophomores earn industry-recognized credentials such as the OSHA-10 safety card or SolidWorks CSWA certification; juniors rotate through two unpaid job-shadowing experiences and one paid internship averaging $15 to $18 per hour; and seniors complete a 90-hour capstone internship with compensation ranging from $20 to $25 per hour, depending on the host employer. This escalation ensures that by graduation, students have accumulated between 200 and 400 hours of documented industry experience that transfers directly onto college transcripts or apprenticeship applications.
Districts constructing similar pipelines must first map their regional economy using publicly available labor market data from the Bureau of Labor Statistics and state workforce boards. Identify the five highest-growth industry sectors within a 45-mile radius, then audit existing program offerings against that data. In communities adjacent to logistics hubs, distribution and supply chain programs thrive; in regions with semiconductor fabrication plants, mechatronics and cleanroom technician pathways command premium placement rates. The alignment must be empirical, not aspirational.
Legal guardrails govern these arrangements, and districts that overlook them risk costly liability. Federal child labor restrictions under the Fair Labor Standards Act limit hazardous occupations for workers under 18, while state laws layer additional constraints, particularly around working hours during the school week. Most states cap employment at 28 hours per week during academic sessions for minors under 16, and many prohibit overnight shifts. Districts must secure general liability coverage of at least $1 million per occurrence and require participating employers to carry workers’ compensation insurance that covers interns. A formal memorandum of understanding between the district, the employer, and the student’s parent or guardian should specify transportation arrangements, supervision ratios, and confidentiality protocols for any proprietary technology students encounter.
Compensation structures vary considerably. Entry-level paid internships typically align with state minimum wage, which currently ranges from $7.25 per hour in states that default to the federal floor to over $16 per hour in California and Washington. However, competitive pathways targeting technical fields frequently exceed these floors, with engineering and healthcare placements commonly offering $15 to $25 per hour, especially when students possess verified credentials. Employers benefit from substantial tax incentives that improve the economics of participation. The federal Work Opportunity Tax Credit (WOTC) historically provided up to $2,400 per qualified hire from targeted groups, though applicants must file Form 8850 within 28 days of hire to claim the benefit. Many states layer additional incentives; for example, Georgia’s High Demand Apprenticeship Tax Credit and Ohio’s Industry-Recognized Credential Tax Credit reward employers who host students pursuing stackable credentials.
For districts initiating these partnerships, a practical sequence accelerates success. Begin by convening a stakeholder summit that includes the regional economic development organization, the local community college president, and at least three employers from each target industry cluster. Draft a three-year partnership charter outlining shared governance, data-sharing agreements, and mutual accountability metrics. Secure board approval for a work-based learning coordinator position, ideally funded through Perkins Act allocations or state career-technical education grants. Finally, establish a public dashboard tracking student placement rates, average wages, and credential attainment, because transparency builds the trust necessary for sustained employer engagement.
Measuring ROI: Outcomes, Earnings Data, and College-Readiness Metrics
Parents, students, and district leaders increasingly ask the same essential question when evaluating high school career pathways: does this program actually deliver measurable results? In an era of tightening budgets and heightened accountability under the Strengthening Career and Technical Education for the 21st Century Act (Perkins V), the answer must be grounded in data, not anecdote. The strongest evidence comes from longitudinal studies tracked through state longitudinal data systems (SLDS), which link K-12 records to postsecondary enrollment, industry certification outcomes, and wage data drawn from state workforce agencies and the IRS. When you evaluate any career-connected learning program for the 2026 academic year, demand that the district or provider show you these three categories of proof: earnings differentials, postsecondary enrollment rates, and certification completion.
The earnings data tells a compelling story. According to multiple longitudinal studies, CTE concentrators (students who complete three or more courses in a single career pathway) earn between $2,000 and $5,000 more annually in their early career years compared to non-CTE peers with similar demographic profiles. That premium holds even when controlling for socioeconomic status and prior academic achievement. The gap widens significantly for students who stack industry-recognized credentials during high school. A certified welder, pharmacy technician, or AWS Cloud Practitioner who enters the workforce at 18 can out-earn a peer with an associate degree by their mid-20s, and the differential compounds over a lifetime. Programs that integrate paid work-based learning, particularly those tied to registered apprenticeship pathways, consistently produce the strongest wage trajectories in the first three years after graduation.
College-readiness metrics dismantle a persistent myth: that career pathways are a detour from higher education. In reality, approximately 91% of CTE concentrators enroll in some form of postsecondary education within twelve months of high school completion, according to the National Center for Education Statistics (NCES). This enrollment rate is statistically indistinguishable from the general high school graduate population, yet CTE students arrive on campus with a distinct advantage. They carry industry credentials that translate into college credit at community and technical colleges through articulation agreements, they possess clearer majors that reduce remediation needs, and they demonstrate persistence rates that are 8-12 percentage points higher than peers who enter college without a defined career focus.
Certification completion varies dramatically by program model, which is why comparative data matters when you are choosing a pathway. Consider the three dominant structures operating in American high schools today:
- Traditional CTE Concentrator Models: Students complete a sequence of three to four career-technical courses in a designated field (health sciences, information technology, manufacturing, or business). Certification pass rates typically range from 45% to 65%, depending on the credential and the quality of instructor professional development. These programs are widely available, ABET- or AASCB-aligned in select pathways, and well-integrated with state career clusters.
- Early College High School Models: Operating in over 280 designated early colleges across 33 states, these programs allow students to earn an associate degree or substantial college credit tuition-free while completing their high school diploma. Certification pass rates climb to 70%-80% because of the extended learning time and dual-credit rigor. Early college models report postsecondary completion rates (within two years of high school graduation) that are roughly 30% higher than peer district averages, and FAFSA completion rates that frequently exceed 85%.
- Apprenticeship-Integrated Pathways: The fastest-growing model, these programs combine classroom instruction with paid on-the-job training under a registered apprenticeship sponsor. Though smaller in scale, they post the highest certification attainment (often 85%+) and the strongest immediate-earnings outcomes. Because apprentices are paid learners, FAFSA completion is less central, but students who pursue the college-credit hybrid track consistently report the highest satisfaction and lowest student debt at age 24.
One overlooked but critical metric is the correlation between FAFSA completion and career program participation. Districts that embed financial aid advising directly into CTE pathways, including mandatory FAFSA workshops during junior year health sciences or engineering concentrator cohorts, see completion rates climb from a national average near 55% to over 75%. This matters because FAFSA completion is the single strongest predictor of postsecondary enrollment for low- and middle-income students. When a career pathway treats college financing as part of the curriculum rather than an afterthought, students benefit twice: they earn industry credentials and they unlock the Pell Grants and state aid that make their next step affordable.
How can you, as a parent or policymaker, verify these claims for your local program? Ask the district for three specific data points from their state longitudinal data system: the percentage of CTE concentrators who earned an industry credential before graduation, the median wage of program completers at the 6-month and 24-month mark after exit, and the postsecondary persistence rate at year two. If the district cannot produce these figures, that is a red flag. High-quality programs track alumni outcomes rigorously because Perkins V accountability and state-level CTE funding formulas now tie dollars to demonstrable results. The Career Connected Learning landscape in 2026 rewards transparency, and the best programs publish their outcome dashboards publicly for families and community partners to review.
Implementation Roadmap: Steps for District Leaders to Launch or Expand Programs by 2026
Launching or expanding a high school career pathway program is a multi-year undertaking that demands disciplined sequencing, strong fiscal stewardship, and authentic community engagement. District leaders who treat this work as a strategic initiative rather than a peripheral add-on consistently achieve stronger student outcomes, more durable industry partnerships, and more reliable streams of federal and state funding. The seven-phase roadmap below translates national policy into a concrete, district-ready plan, culminating in fully operational programs by the start of the 2026-2027 academic year.
Phase 1: Regional Labor Market Analysis (Spring 2024 to Fall 2024)
- Pull occupational projections from the Bureau of Labor Statistics (BLS) Projections suite and your state workforce development board, filtering for middle-skill credentials paying a living wage in your commuting zone.
- Map clusters of growth in advanced manufacturing, health sciences, information technology, clean energy, and skilled trades, then cross-reference with employer demand signals from local chambers and regional apprenticeship sponsors.
- Present findings to your school board and publish an open dashboard so families, counselors, and industry partners can verify the labor-market rationale behind every pathway you greenlight.
Phase 2: Securing Perkins V and State Grant Funding (Summer 2024 to Spring 2025)
- Allocate the federal Perkins V Basic State Grant (typically distributed through state education agencies each spring) to equipment, work-based learning coordination, and teacher professional development.
- Layer state Career and Technical Education (CTE) incentive grants, WorkKeys and ACT WorkReady Community grants, and any local millage or bond proceeds designated for college and career readiness.
- Build a competitive narrative that names regional employer partners, projected enrollment, and how funds will close equity gaps for students from underrepresented groups, a feature that earns extra points in most state rubrics.
Phase 3: Dual Enrollment Agreements with Community Colleges (Fall 2024 to Spring 2025)
- Negotiate statewide or regional dual enrollment contracts that lock in tuition at the in-district community college rate, often $50 to $100 per credit hour for public high school students.
- Align pathway coursework with credentials recognized by accrediting bodies such as the Higher Learning Commission, Middle States Commission on Higher Education, or regionally equivalent agencies so credits transfer cleanly.
- Include a clear cost-sharing clause so districts, families, and the postsecondary partner each understand which fees, textbooks, and certification exams they cover.
Phase 4: Makerspace and Lab Infrastructure Design (Fall 2024 to Summer 2025)
- Plan a right-sized facility: a focused makerspace for grades 9-10 typically runs $50,000 to $120,000, while a fully equipped CTE lab with industry-grade tooling, ventilation, and IT backbones can reach $250,000 to $500,000.
- Use the SchoolDude and state facilities planning guides to verify electrical load, HVAC capacity, and ADA accessibility before signing a construction contract.
- Sequence purchases so simulation and software licenses (often $5,000 to $25,000 annually) are operational before equipment arrives, allowing teachers to pilot curriculum during the build-out phase.
Phase 5: Recruiting Industry Partners and Advisory Board Members (Winter 2024 to Spring 2025)
- Convene a formal CTE Advisory Committee that meets twice yearly and includes employers, parents, postsecondary faculty, and current students, mirroring the structure required for programs affiliated with accreditors such as ABET and AACSB at the postsecondary level.
- Ask each partner to commit in writing to work-based learning slots, mentorship hours, and equipment donations, then track deliverables through a shared CRM so progress is transparent.
- Use the National Career Clusters Framework to keep advisory conversations anchored in shared terminology and labor-market data.
Phase 6: CTE-Credentialed Teacher Recruitment and Training (Spring 2025 to Summer 2026)
- Hire educators who hold a state CTE credential, an industry certification, or a documented years-of-experience pathway that satisfies your state’s alternative-route requirements.
- Fund summer externships, typically $4,000 to $8,000 per teacher, so instructors spend 40 to 80 hours embedded with a regional employer and return with current technical knowledge.
- Schedule quarterly professional learning communities led by community college faculty to keep dual enrollment instruction rigorous and aligned with postsecondary expectations.
Phase 7: Evaluation Framework Aligned with ESSA (Spring 2025 to Fall 2026)
- Embed the Every Student Succeeds Act (ESSA) College, Career, and Civic Readiness (CCCR) indicator so your pathway data counts toward the state’s accountability system.
- Track leading measures (ninth-grade credit accumulation, work-based learning hours, credential attainment) alongside lagging measures (postsecondary enrollment and persistence).
- Publish an annual public report card so families, school board members, and funders can see return on investment in clear dollar and percentage terms.
Milestone Timeline at a Glance
- Spring 2024: Convene steering committee, complete labor-market analysis, and pass a board resolution of support.
- Fall 2024: Submit Perkins V application, sign dual enrollment MOU, and launch industry partner recruitment.
- Spring 2025: Award CTE grants, finalize architectural plans, and hire pathway coordinator.
- Summer 2025: Renovate labs, purchase equipment, and place teachers in industry externships.
- Fall 2025: Soft-launch pilot courses, enroll first cohort, and begin collecting baseline ESSA-aligned metrics.
- Spring 2026: Award industry credentials, host family information nights, and conduct a mid-year program audit.
- Fall 2026: Officially launch the full career pathways system, report outcomes publicly, and plan the next three-year expansion cycle.
Executed with discipline, this roadmap transforms federal Perkins V dollars, state CTE funding, and local bond capacity into a sustainable talent pipeline. By pairing rigorous labor-market analysis with ESSA-aligned evaluation, districts not only qualify for current funding streams but also position themselves to compete successfully for the next generation of Good Jobs and Innovation-style federal investments that will shape American workforce development through 2030.
| Pathway Type | Average Cost (2026) | Credential/Cut-Off | Completion Timeline | Career ROI (10-Yr Avg Salary) | Accreditation Body |
|---|---|---|---|---|---|
| Career & Technical Education (CTE) Concentrator | $0 – $500 (public school fees) | 2 credits in single CTE pathway (state-mandated) | 2 years (Grades 11-12) | $52,000 – $68,000 | State Dept. of Education + Perkins V |
| Industry-Recognized Credential (IRC) | $50 – $350 exam fee | Passage of state-approved IRC exam (e.g., CompTIA, AWS Academy) | 1 semester – 1 year | $58,000 – $75,000 | National Skill Standards Board / Industry Partner |
| Work-Based Learning (WBL) Apprenticeship | $0 (earn-while-you-learn) | U.S. DOL Registered Apprenticeship (2,000+ hours) | 1 – 2 years concurrent | $72,000 – $95,000 | U.S. Dept. of Labor Office of Apprenticeship |
| Dual Enrollment CTE (College Credit) | $0 – $150 per credit hour | C or better in technical college course | 1 semester – 2 years | $62,000 – $82,000 | Accrediting Commission for Community & Junior Colleges (ACCJC) |
| JROTC Military Pathway | $0 (uniform provided) | Cadet Command completion + ASVAB score (31+) | 3-4 years (Grades 9-12) | $45,000 – $65,000 (enlisted) | DoD Military Service Branch |
| Pre-Apprenticeship Bridge Program | $0 – $200 materials | Program completion certificate; minimum 16 yrs old | 6 months – 1 year | $55,000 – $78,000 | State Apprenticeship Council |
Frequently Asked Questions
What is a Career and Technical Education (CTE) pathway in high school?
A CTE pathway is a coordinated sequence of two or more CTE courses in a single career field that meets state academic and technical standards. Under Perkins V funding, students become 'concentrators' by earning at least two credits, preparing them for industry-recognized certifications or postsecondary training.
How does Perkins V funding support high school career programs in 2026?
Perkins V provides over $1.4 billion annually to states for secondary and postsecondary CTE programs. The 2026 allocation prioritizes non-traditional fields, rural districts, and underserved students. Funding supports equipment, teacher training, and work-based learning, governed by local Comprehensive Local Needs Assessments (CLNA) for accountability.
Are high school industry credentials accredited and recognized by employers?
Yes, Industry-Recognized Credentials (IRCs) listed on state approved-skill standards boards are validated by the National Skills Standards Board. Certifications from AWS, CompTIA, NCCER, and ASE are widely accepted by employers and frequently articulate to college credit through articulation agreements with community colleges and universities nationwide.
What is the difference between a CTE pathway and a registered apprenticeship?
A CTE pathway is a secondary-school sequence of technical courses aligned to state standards, while a registered apprenticeship is a U.S. Department of Labor-approved earn-and-learn model requiring 2,000+ hours of structured on-the-job training plus classroom instruction. Apprenticeships guarantee wages and lead directly to journeyman status.
Strategic Final Takeaway
Success in evaluating High School Career Pathways: 2026 Funding & Accreditation Guide relies on early preparation, adherence to verified accredited requirements, and cross-referencing official portals. Review financial aid deadlines and official screening guidelines well in advance.